
 Nasdaq
 华尔街日报
华尔街日报Wavestone (ENXTPA:WAVE): Assessing Valuation After Earnings-Driven Net Income and EPS Growth
Wavestone (ENXTPA:WAVE) just posted half year earnings that quietly shift the narrative, as net income and earnings per share grew while sales were essentially flat, giving investors a cleaner read on profitability.
See our latest analysis for Wavestone.
The market seems to be rewarding that earnings momentum, with a roughly 16 percent 1 month share price return and about 35 percent year to date share price gain. The 1 year total shareholder return near 37 percent suggests solid, building confidence rather than a speculative spike.
If Wavestone's steady compounding has your attention, this could be a good moment to discover fast growing stocks with high insider ownership for other high conviction growth ideas.
With earnings beating profit expectations while revenue edges up only modestly, and the share price already closing in on analyst targets, investors now face a key decision: is there still upside here or is future growth already priced in?
Price-to-Earnings of 18x: Is it justified?
On a trailing basis Wavestone trades at about 18 times earnings, a level that prices in solid performance rather than a deep value opportunity.
The price to earnings ratio compares the company’s share price with its per share profits, making it a useful gauge of how much investors are paying for each unit of current earnings in a mature, profitable consulting and IT services business.
Here, the picture is nuanced. Wavestone screens as expensive versus its immediate peer group average of 12.2x, yet still looks reasonably aligned with the broader European IT sector at 18.8x, and even modestly below the 19.9x fair price to earnings ratio implied by regression analysis, a level the market could plausibly gravitate toward if earnings delivery stays on track.
Explore the SWS fair ratio for Wavestone
Result: Price-to-Earnings of 18x (ABOUT RIGHT)
However, investors should still watch for slowing revenue growth near 4 percent and any pullback if shares overshoot analyst targets after a strong multiyear run.
Find out about the key risks to this Wavestone narrative.
Another View: Discounted Cash Flow Check
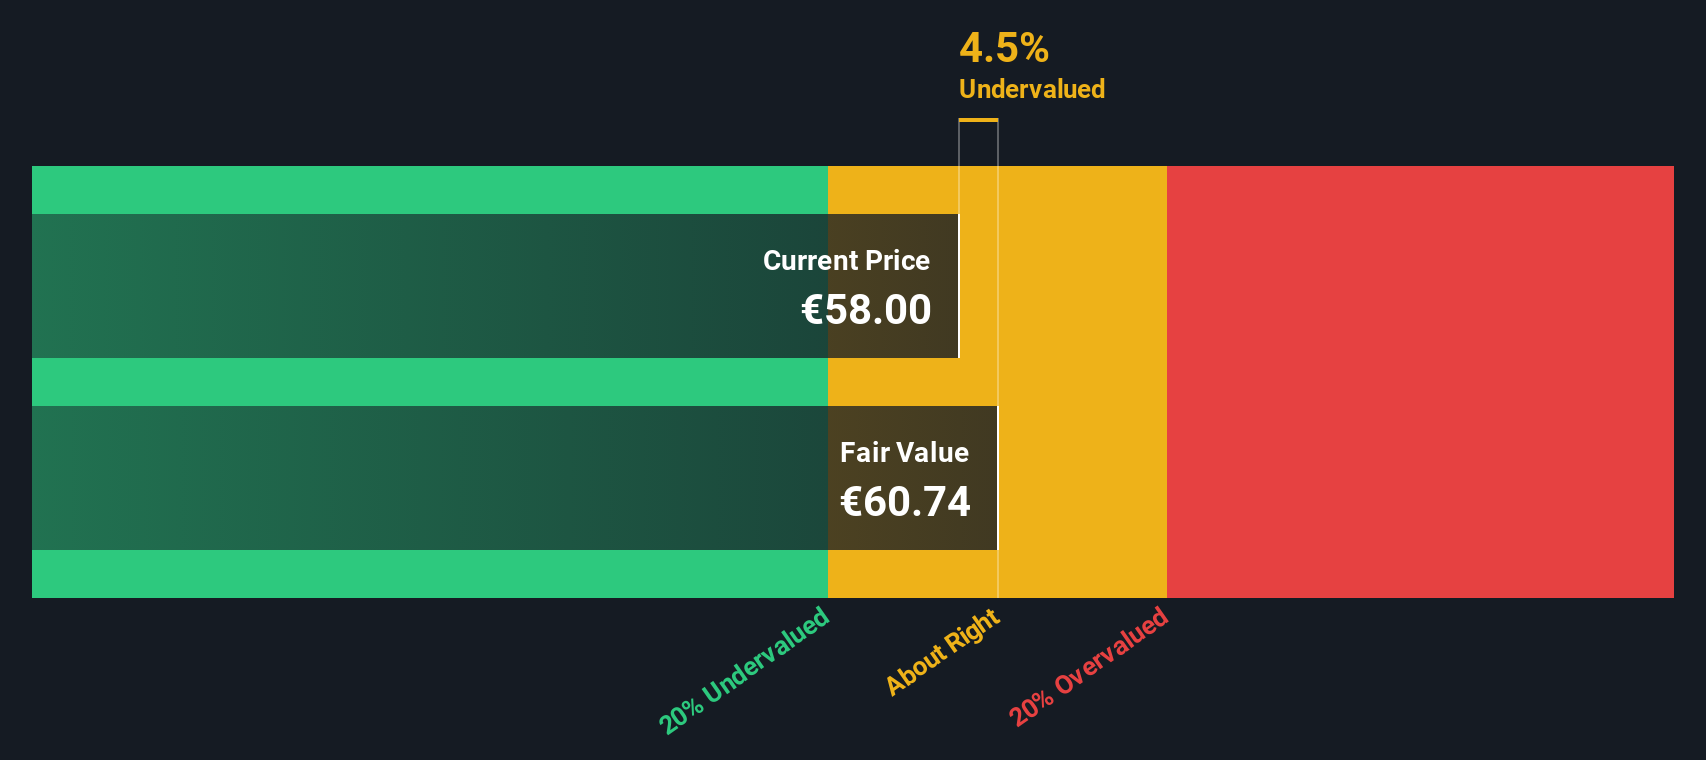
While the 18x earnings multiple suggests Wavestone is roughly fairly priced, our DCF model indicates a slight undervaluation, with the shares about 4.5 percent below an estimated fair value of roughly €60.74. Whether that small gap represents a margin of safety or simply noise remains open to interpretation.
Look into how the SWS DCF model arrives at its fair value.
Simply Wall St performs a discounted cash flow (DCF) on every stock in the world every day (check out Wavestone for example). We show the entire calculation in full. You can track the result in your watchlist or portfolio and be alerted when this changes, or use our stock screener to discover 908 undervalued stocks based on their cash flows. If you save a screener we even alert you when new companies match - so you never miss a potential opportunity.
Build Your Own Wavestone Narrative
If you see the story differently or want to test your own assumptions against the numbers, you can build a personalized view in under three minutes: Do it your way.
A good starting point is our analysis highlighting 3 key rewards investors are optimistic about regarding Wavestone.
Ready for your next investment move?
Before you move on, you may wish to explore the Simply Wall St Screener to uncover fresh, data driven ideas that many investors may not be focusing on.
- Look for potential mispriced opportunities by targeting these 908 undervalued stocks based on cash flows that markets may not have fully recognized yet.
- Consider the next wave of innovation by focusing on these 26 AI penny stocks involved in the development of intelligent technology.
- Explore ways to strengthen an income strategy with these 13 dividend stocks with yields > 3% that may contribute to portfolio stability and cash flow.
This article by Simply Wall St is general in nature. We provide commentary based on historical data and analyst forecasts only using an unbiased methodology and our articles are not intended to be financial advice. It does not constitute a recommendation to buy or sell any stock, and does not take account of your objectives, or your financial situation. We aim to bring you long-term focused analysis driven by fundamental data. Note that our analysis may not factor in the latest price-sensitive company announcements or qualitative material. Simply Wall St has no position in any stocks mentioned.
Have feedback on this article? Concerned about the content? Get in touch with us directly. Alternatively, email editorial-team@simplywallst.com