
 Nasdaq
 华尔街日报
华尔街日报Innoviva (INVA): Revisiting Valuation After a Strong Multi‑Year Share Price Run
Innoviva (INVA) has quietly put together a strong multiyear run, with the stock up around 61% over the past 3 years as its royalty driven respiratory portfolio continues to generate substantial cash.
See our latest analysis for Innoviva.
Over the last year, Innoviva’s share price return has been robust, with an 18.56% year to date gain and a 3 year total shareholder return of 61.55%. This suggests momentum is still skewed to the upside despite the recent 1 month pullback.
If Innoviva’s steady royalty stream has you thinking about other resilient healthcare names, this could be a good moment to scout healthcare stocks for fresh ideas.
With Innoviva still trading at a steep discount to analyst targets despite solid royalty cash flows and expanding anti infective assets, is the market overlooking its embedded value or already pricing in the next leg of growth?
Price-to-Earnings of 12.1x: Is it justified?
Innoviva trades on a price-to-earnings ratio of 12.1x at a last close of $20.63, which points to a valuation that screens as clearly undervalued versus fundamentals.
The price-to-earnings multiple compares the current share price to the company’s earnings. It is a core yardstick for cash generative, profitable pharmaceutical businesses like Innoviva.
With earnings up 97.2% over the past year and forecast to keep growing, a 12.1x multiple suggests the market is pricing in far more modest profit momentum than the company is actually delivering. Relative to an estimated fair price-to-earnings ratio of 17x, there appears to be meaningful room for the market’s valuation to converge upwards if Innoviva continues to execute.
Compared with the broader US Pharmaceuticals industry average of 19.7x and a peer group average of 26.7x, Innoviva’s 12.1x price-to-earnings ratio looks strikingly conservative, implying investors are applying a sizeable discount despite solid growth and high quality earnings.
Explore the SWS fair ratio for Innoviva
Result: Price-to-Earnings of 12.1x (UNDERVALUED)
However, sustained royalty dependence and execution risk in expanding anti infective assets could quickly challenge today’s valuation upside if growth underwhelms expectations.
Find out about the key risks to this Innoviva narrative.
Another View, Our DCF Fair Value Check
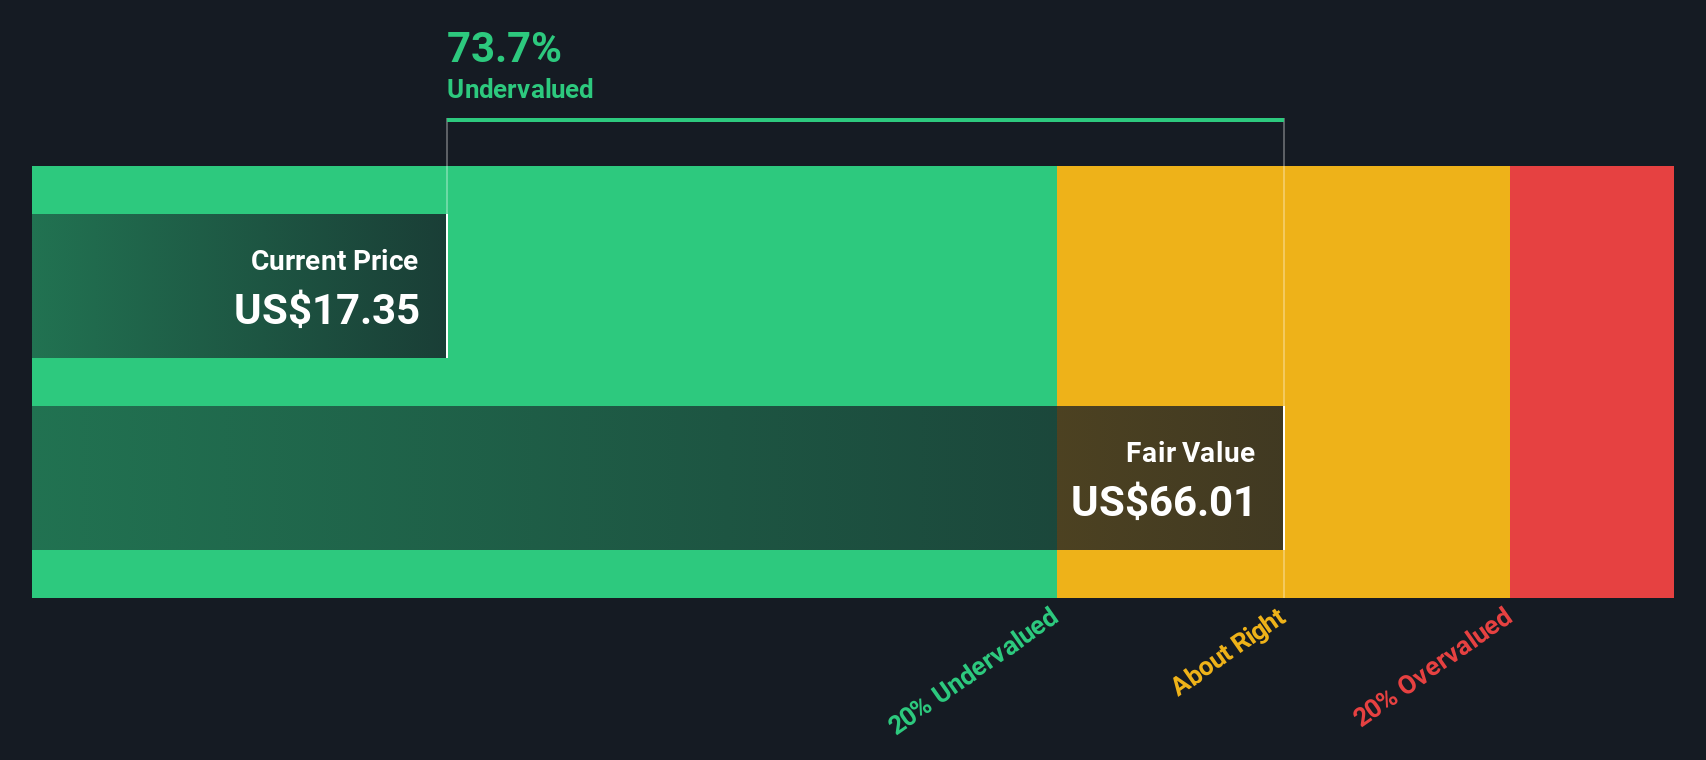
While a 12.1x earnings multiple points to value, our DCF model is even more optimistic. It suggests Innoviva is trading at a roughly 62% discount to its fair value of $54.61 per share. If both are correct, sentiment could be lagging far behind the fundamentals.
Look into how the SWS DCF model arrives at its fair value.
Simply Wall St performs a discounted cash flow (DCF) on every stock in the world every day (check out Innoviva for example). We show the entire calculation in full. You can track the result in your watchlist or portfolio and be alerted when this changes, or use our stock screener to discover 908 undervalued stocks based on their cash flows. If you save a screener we even alert you when new companies match - so you never miss a potential opportunity.
Build Your Own Innoviva Narrative
If this perspective does not fully align with your own view, explore the numbers yourself and develop a custom thesis in minutes with Do it your way.
A great starting point for your Innoviva research is our analysis highlighting 4 key rewards and 1 important warning sign that could impact your investment decision.
Ready for your next investing move?
Take the momentum from Innoviva and put it to work, use the Simply Wall St screener now or risk missing companies quietly building tomorrow’s returns.
- Capture income potential by scanning these 13 dividend stocks with yields > 3% that can help anchor your portfolio with reliable cash flows.
- Position yourself early in frontier innovation through these 27 quantum computing stocks shaping the next wave of computing breakthroughs.
- Capitalize on market mispricing by sifting through these 908 undervalued stocks based on cash flows where strong fundamentals are not yet fully recognized.
This article by Simply Wall St is general in nature. We provide commentary based on historical data and analyst forecasts only using an unbiased methodology and our articles are not intended to be financial advice. It does not constitute a recommendation to buy or sell any stock, and does not take account of your objectives, or your financial situation. We aim to bring you long-term focused analysis driven by fundamental data. Note that our analysis may not factor in the latest price-sensitive company announcements or qualitative material. Simply Wall St has no position in any stocks mentioned.
Have feedback on this article? Concerned about the content? Get in touch with us directly. Alternatively, email editorial-team@simplywallst.com