
 Nasdaq
 华尔街日报
华尔街日报Does Catalyst Pharmaceuticals Still Offer Value After Its 559.8% Five Year Surge in 2025?
- Wondering if Catalyst Pharmaceuticals is still a smart buy after its big run, or if the best gains are already behind it? Let us unpack whether the current price really matches what the business is worth.
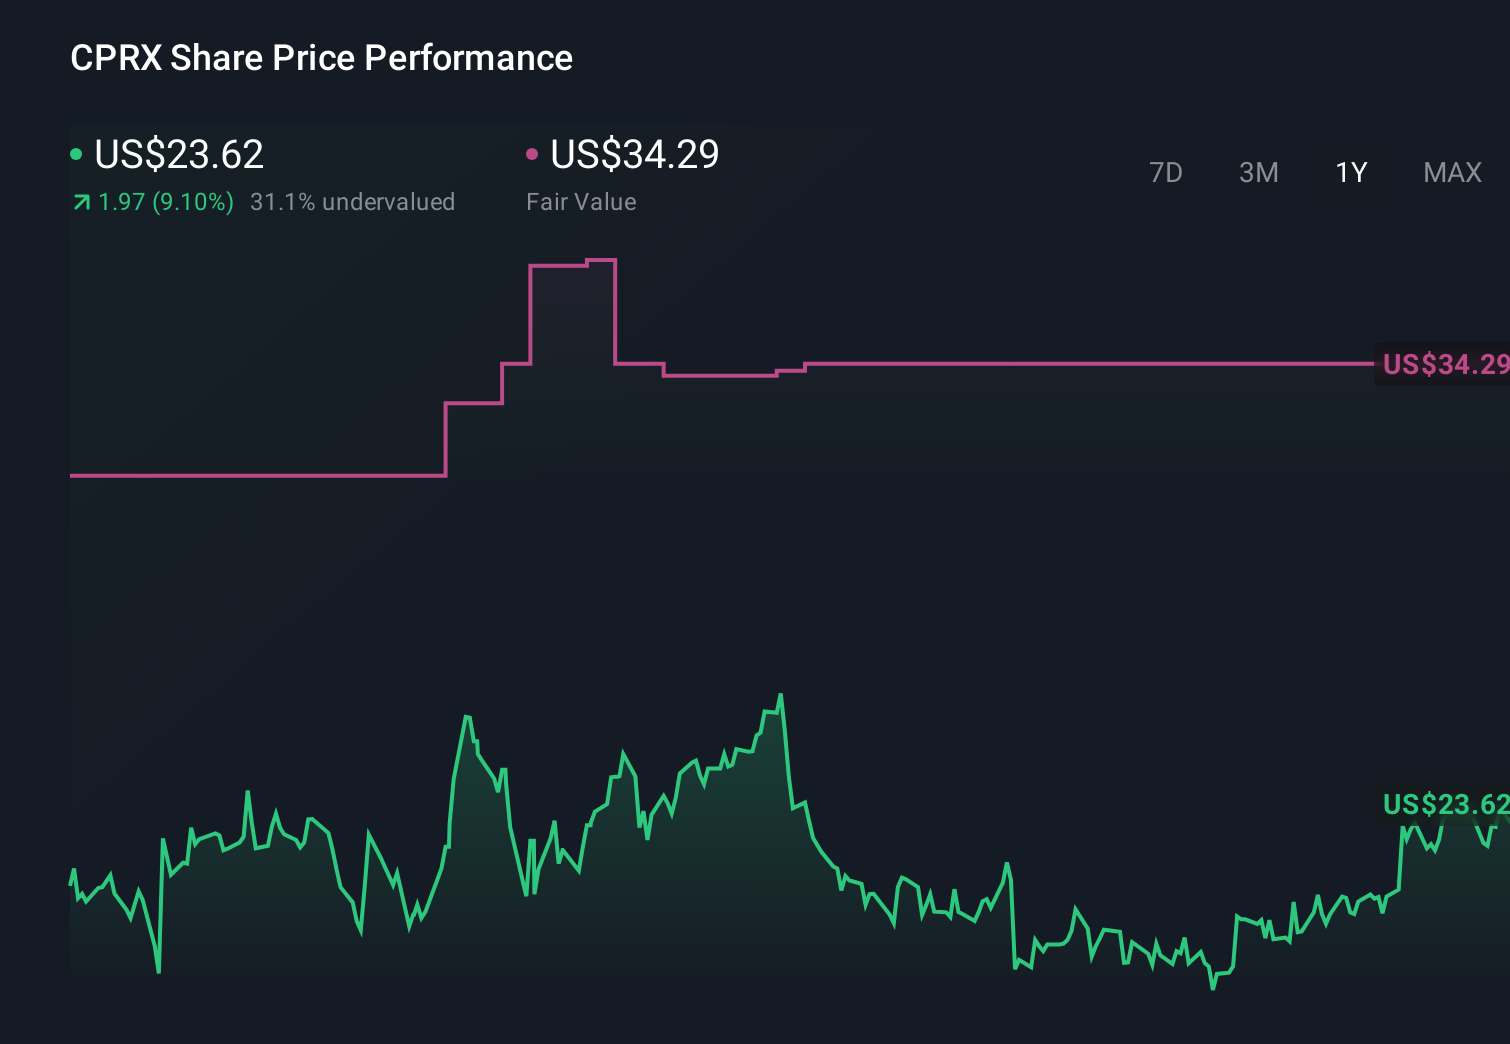
- The stock has delivered a modest 0.4% gain over the last week and 3.7% over the past month, but zooming out shows a stronger 9.8% year to date and a massive 559.8% over five years. This naturally raises questions about how much upside is left.
- Recent attention around Catalyst has focused on its rare disease portfolio and strategic moves to strengthen its neurology franchise. This has helped support the share price after such a strong multi year climb. At the same time, investors are increasingly weighing how sustainable its current revenue base is in a shifting regulatory and competitive landscape.
- On our checklist of six core valuation tests, Catalyst scores a perfect 6/6, suggesting the market may still be underestimating it, but headline numbers never tell the full story. Next we will break down how different valuation approaches view the stock today, and later in the article we will look at an even more powerful way to judge whether the current price really makes sense.
Find out why Catalyst Pharmaceuticals's 10.5% return over the last year is lagging behind its peers.
Approach 1: Catalyst Pharmaceuticals Discounted Cash Flow (DCF) Analysis
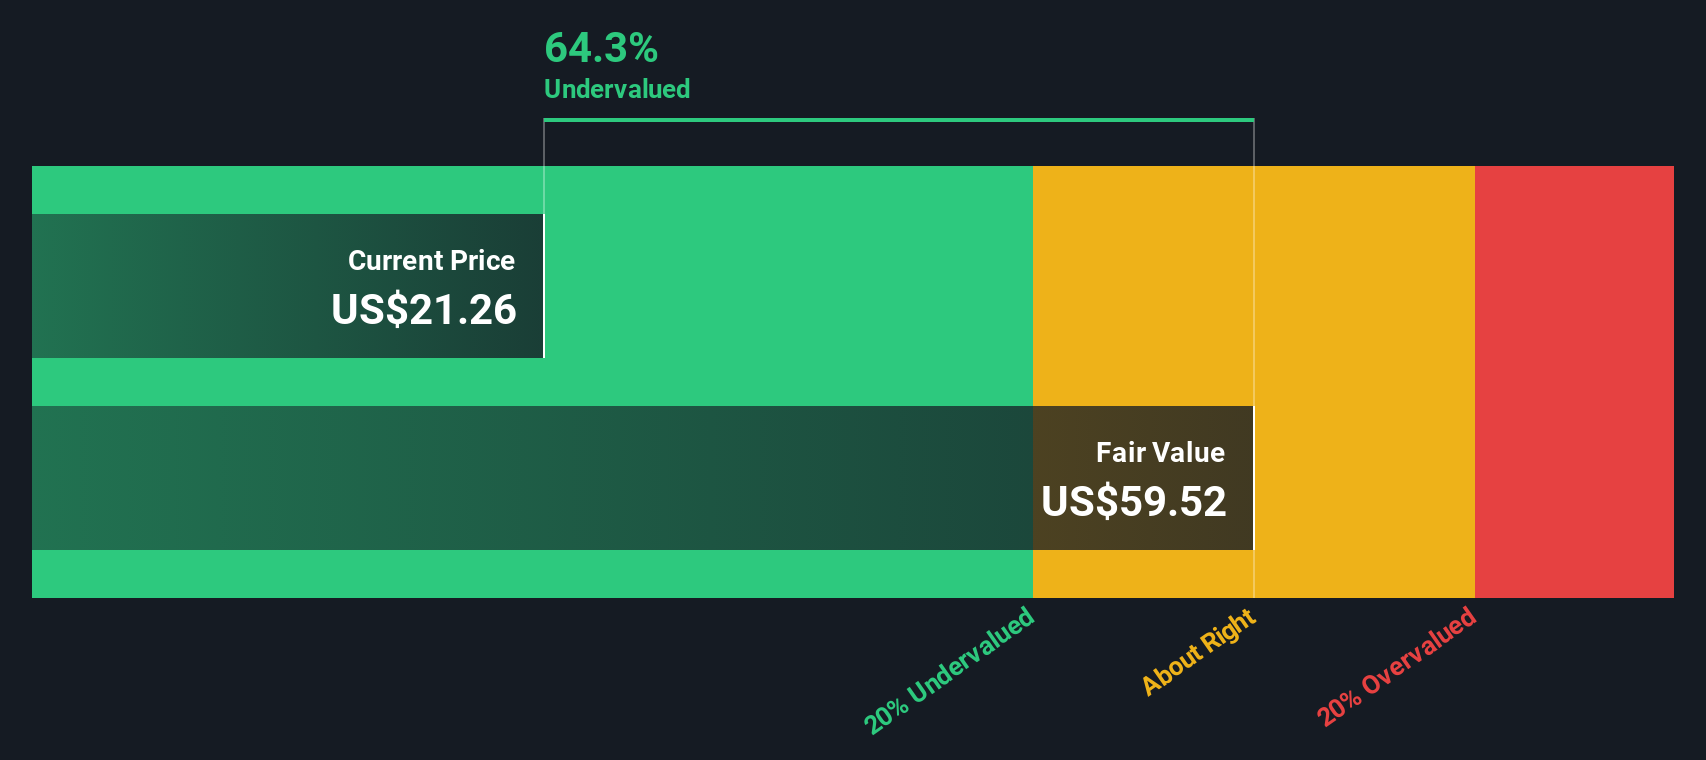
A Discounted Cash Flow model estimates what a company is worth by projecting its future cash flows and then discounting them back into today’s dollars. For Catalyst Pharmaceuticals, the 2 Stage Free Cash Flow to Equity model starts with last twelve month free cash flow of about $151.7 million and then applies analyst forecasts and longer term growth assumptions.
Analysts expect free cash flow to rise to roughly $298 million by 2029, with further projections extending out to 2035 using gradually moderating growth rates. All of these future cash flows are discounted back to the present and summed to arrive at an estimated intrinsic value of about $59.67 per share.
Compared with the current share price, this implies the stock is trading at a 60.4% discount to its modeled fair value. This suggests the market is pricing in far weaker cash flow prospects than the DCF assumes.
Result: UNDERVALUED
Our Discounted Cash Flow (DCF) analysis suggests Catalyst Pharmaceuticals is undervalued by 60.4%. Track this in your watchlist or portfolio, or discover 903 more undervalued stocks based on cash flows.
Approach 2: Catalyst Pharmaceuticals Price vs Earnings
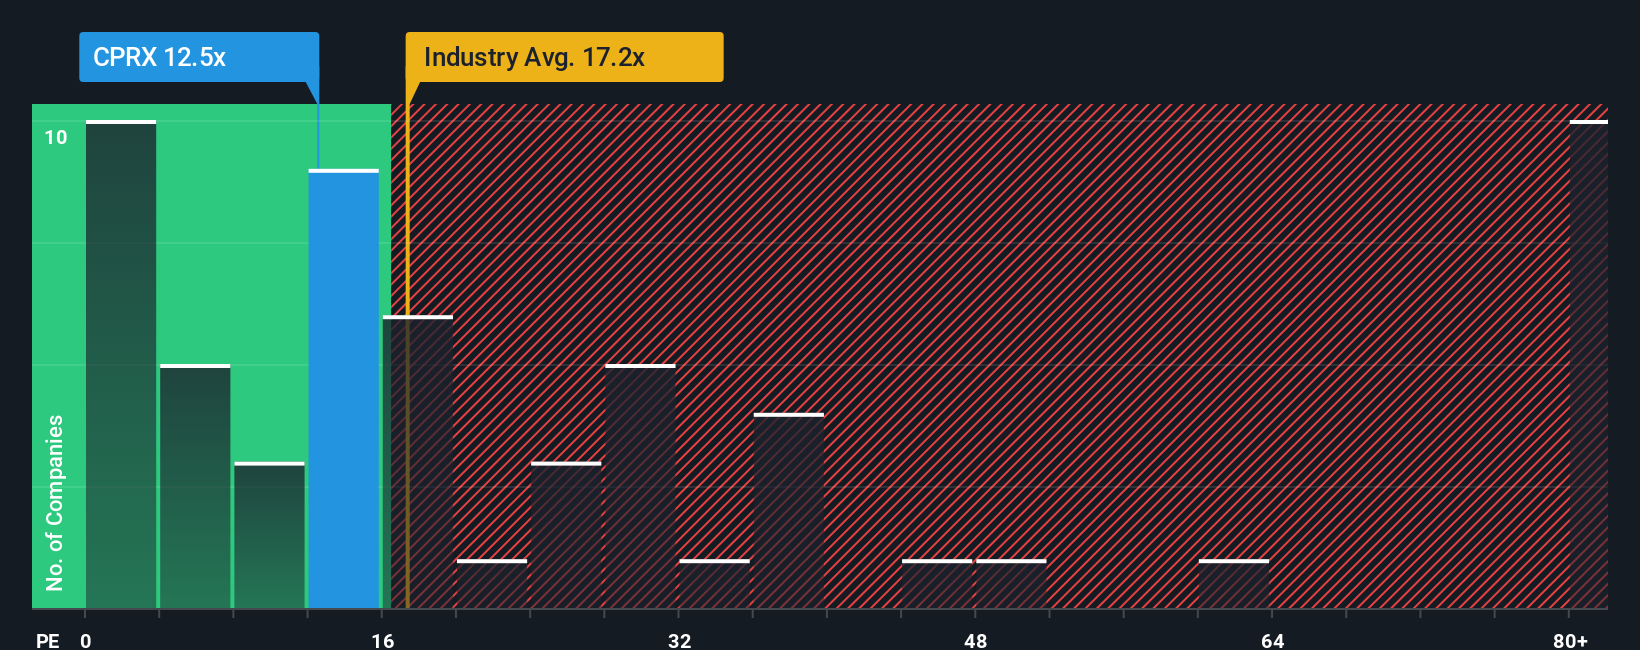
For profitable companies like Catalyst Pharmaceuticals, the price to earnings (PE) ratio is a useful way to gauge how much investors are paying for each dollar of current earnings. A higher PE can be justified when a business is expected to grow strongly and has relatively low risk, while slower growth or higher uncertainty typically call for a lower, more conservative multiple.
Catalyst currently trades at about 13.3x earnings, which is below both the Biotechs industry average of roughly 19.0x and the broader peer group average of about 48.6x. On the surface, that discount might suggest the market is being cautious about its future prospects. However, simple comparisons to industry or peers can be misleading because they ignore company specific factors.
This is where Simply Wall St’s Fair Ratio comes in. Our Fair PE Ratio for Catalyst is 17.9x, which reflects its earnings growth outlook, profitability, risk profile, size, and industry. Because this metric is tailored to the company rather than a broad group, it gives a more nuanced view than blunt peer or sector comparisons. With the shares at 13.3x versus a Fair Ratio of 17.9x, the stock appears undervalued on a PE basis.
Result: UNDERVALUED
PE ratios tell one story, but what if the real opportunity lies elsewhere? Discover 1443 companies where insiders are betting big on explosive growth.
Upgrade Your Decision Making: Choose your Catalyst Pharmaceuticals Narrative
Earlier we mentioned that there is an even better way to understand valuation, so let us introduce you to Narratives, which allow you to attach a clear story, your view of Catalyst’s future revenue, earnings and margins, to the numbers behind its fair value.
A Narrative links three pieces together in a simple, intuitive way, starting with the business story, then turning that story into a financial forecast, and finally translating the forecast into a fair value you can directly compare with today’s share price.
On Simply Wall St’s Community page, millions of investors use Narratives as an accessible tool to decide when to buy or sell, because they can quickly see whether their Fair Value is above or below the current Price and watch that view update dynamically as new earnings reports, news, or guidance come in.
For example, one investor might build a bullish Catalyst Narrative with faster revenue growth and a fair value near 40 dollars. Another, more cautious investor might assume slower growth and higher risk, arriving at a fair value closer to 31 dollars.
Do you think there's more to the story for Catalyst Pharmaceuticals? Head over to our Community to see what others are saying!
This article by Simply Wall St is general in nature. We provide commentary based on historical data and analyst forecasts only using an unbiased methodology and our articles are not intended to be financial advice. It does not constitute a recommendation to buy or sell any stock, and does not take account of your objectives, or your financial situation. We aim to bring you long-term focused analysis driven by fundamental data. Note that our analysis may not factor in the latest price-sensitive company announcements or qualitative material. Simply Wall St has no position in any stocks mentioned.
Have feedback on this article? Concerned about the content? Get in touch with us directly. Alternatively, email editorial-team@simplywallst.com