
 Nasdaq
 华尔街日报
华尔街日报Is SPIE Still Attractive After a 200% Five Year Rally and Rich Earnings Multiple?
How Has SPIE Performed For Shareholders?
Before diving into valuation models and fair value estimates, it is worth grounding the discussion in what really matters to investors: the actual returns SPIE has generated over different time frames.
SPIE shares have delivered strong gains for long term holders, with the stock up 109.8% over three years and 200.8% over five years, far ahead of what many investors would expect from an industrial services business. That kind of compounding sets a high bar for any valuation framework because a lot of good news can quickly get baked into the price.
More recently, performance has remained robust, even if a little more volatile. Year to date the stock is up 54.9% and 57.7% over the last 12 months, while shorter term moves have been more mixed, with a 7.3% gain over the past month but a small 1.4% pullback in the last week.
This pattern of strong multi year returns combined with occasional near term pauses is typical of companies that are being re rated by the market as their strategic position and growth prospects become better appreciated. For investors assessing valuation today, it means we need to distinguish between price moves driven by improving fundamentals and those that may simply reflect shifting sentiment or momentum traders stepping in and out.
In the sections that follow, we will unpack how different valuation methods interpret SPIE, where the current share price sits relative to those estimates, and why looking at a simple 2 out of 6 valuation score is only the starting point for understanding what the market might really be pricing in.
SPIE scores just 2/6 on our valuation checks. See what other red flags we found in the full valuation breakdown.
Approach 1: SPIE Discounted Cash Flow (DCF) Analysis
A Discounted Cash Flow model estimates what a business is worth today by projecting the cash it can generate in the future and then discounting those cash flows back to their value in today’s money.
For SPIE, the model uses a 2 Stage Free Cash Flow to Equity approach. The company generated about €970.9 million in free cash flow over the last twelve months, and analysts expect this to remain robust, with projections such as around €619.0 million in 2026 and €687.6 million by 2029. Beyond the explicit analyst window, Simply Wall St extrapolates further, with projected free cash flow reaching roughly €795.4 million by 2035 as growth gradually normalises.
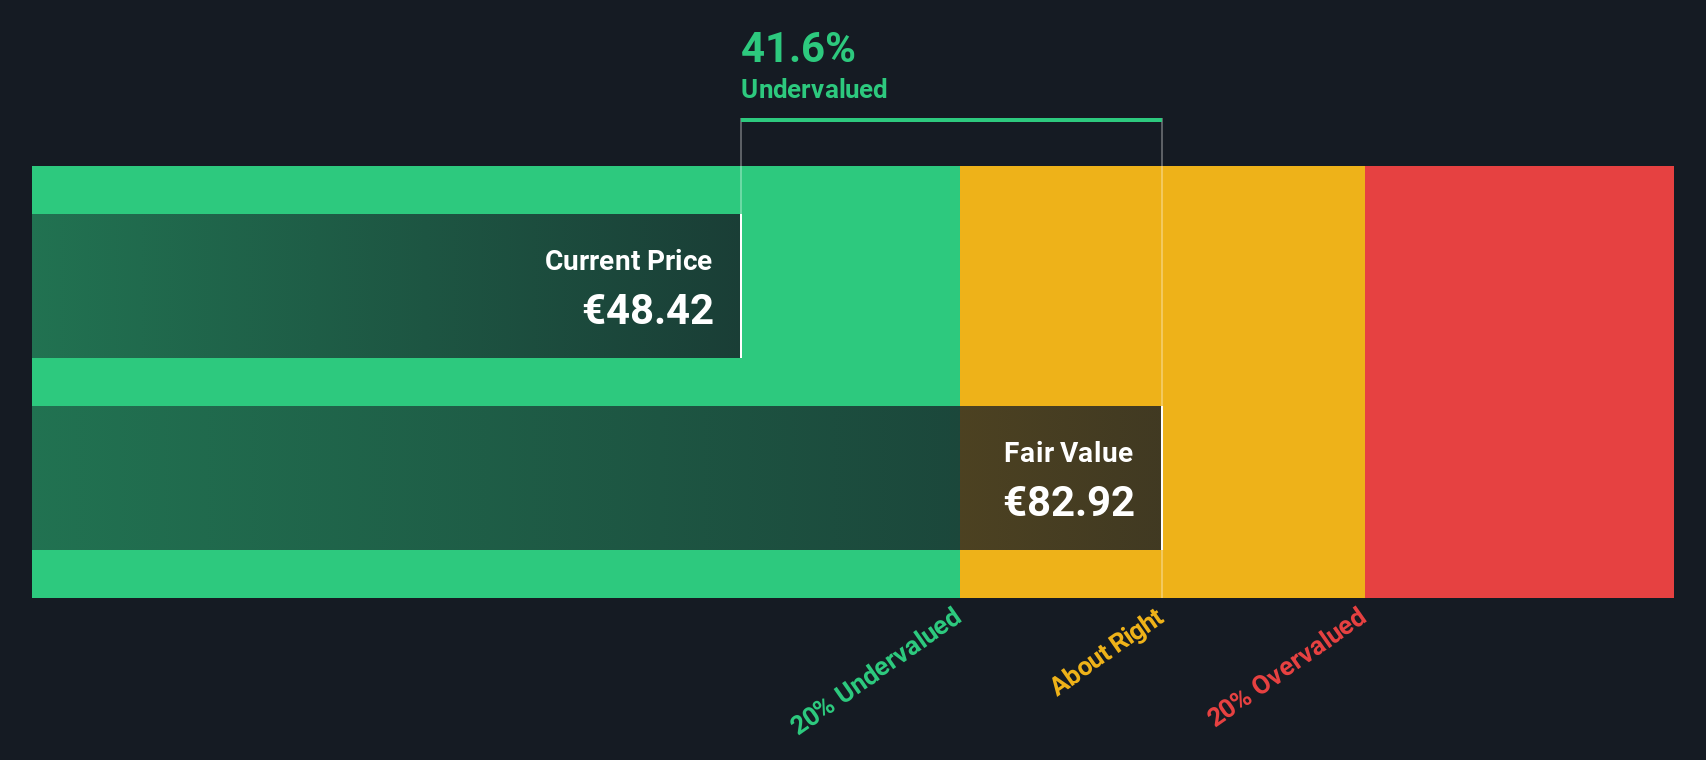
When these future cash flows are discounted back, the model arrives at an intrinsic value of approximately €82.92 per share. Compared with the current market price, this implies SPIE is trading at a 43.9% discount, which suggests the market is not fully reflecting the company’s cash generation potential.
Result: UNDERVALUED
Our Discounted Cash Flow (DCF) analysis suggests SPIE is undervalued by 43.9%. Track this in your watchlist or portfolio, or discover 903 more undervalued stocks based on cash flows.
Approach 2: SPIE Price vs Earnings
For profitable companies like SPIE, the Price to Earnings (PE) ratio is a useful shorthand for how much investors are willing to pay today for each euro of current earnings. In general, businesses with stronger growth prospects and lower perceived risk justify higher PE multiples, while slower growing or riskier firms typically trade on lower multiples.
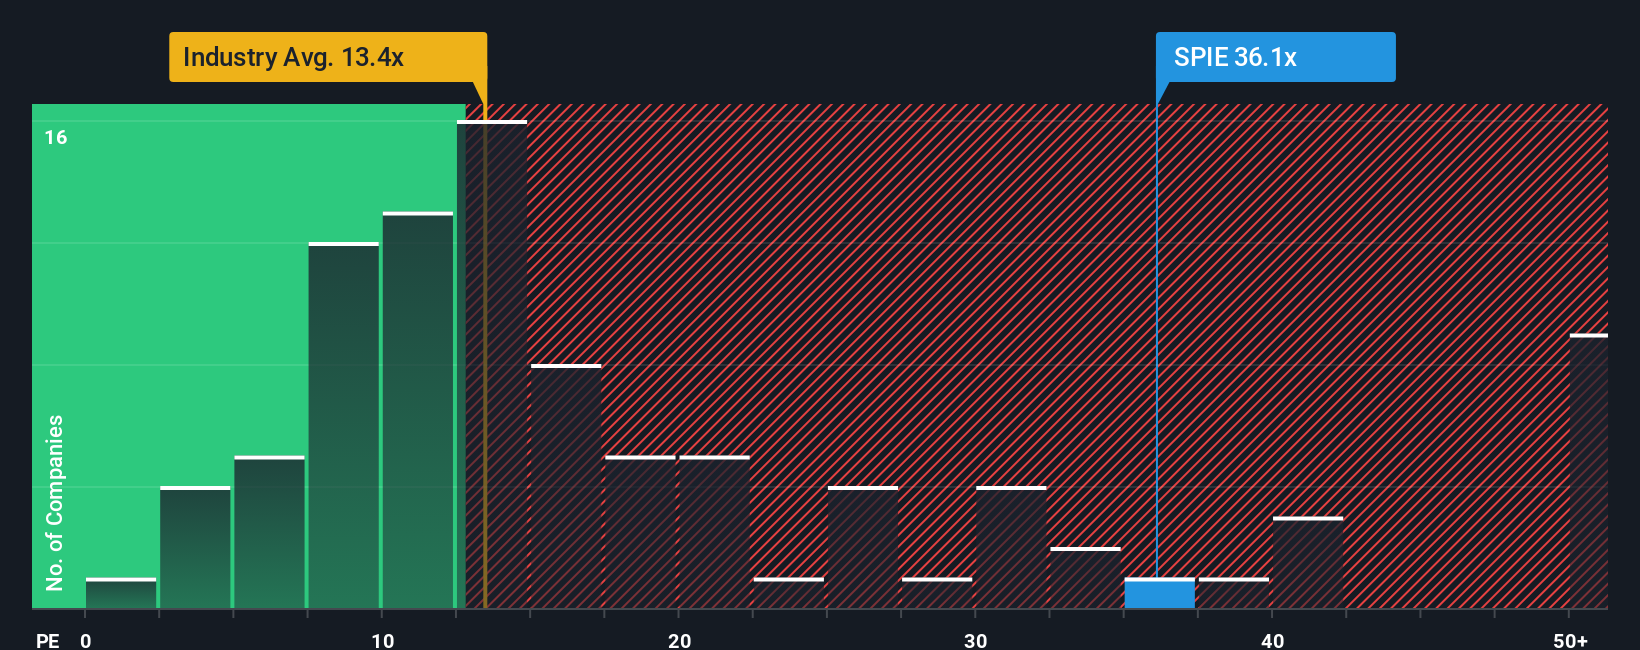
SPIE currently trades on a PE of about 38.5x, which is well above both the Commercial Services industry average of roughly 16.3x and the broader peer average of around 14.0x. On those simple comparisons, the shares look expensive. However, Simply Wall St also calculates a Fair Ratio of 20.0x for SPIE, a proprietary estimate of the PE the stock should trade on given its earnings growth outlook, profit margins, industry dynamics, market cap and company specific risks.
This Fair Ratio is more informative than a straight industry or peer comparison because it adjusts for SPIE’s own fundamentals rather than assuming all companies deserve the same multiple. With the current 38.5x PE sitting significantly above the 20.0x Fair Ratio, the multiple based view points to SPIE being priced on the rich side.
Result: OVERVALUED
PE ratios tell one story, but what if the real opportunity lies elsewhere? Discover 1442 companies where insiders are betting big on explosive growth.
Upgrade Your Decision Making: Choose your SPIE Narrative
Earlier we mentioned that there is an even better way to understand valuation, so let us introduce you to Narratives, a simple but powerful way to connect your view of SPIE’s story with a clear financial forecast and a fair value estimate. A Narrative lets you spell out, in plain language, how you think SPIE’s business will evolve, then tie that story to concrete assumptions for future revenue, earnings and profit margins. On Simply Wall St’s Community page, used by millions of investors, these Narratives are easy to create and compare, helping you decide when to buy or sell by setting your Fair Value against today’s share price. Because Narratives are updated dynamically when fresh information, like earnings or major news, comes in, your fair value view evolves alongside the company. For SPIE, one investor might build a bullish Narrative around revenue climbing toward €11.9 billion with earnings of €564.2 million and a fair value closer to €62.0, while another, more cautious investor assumes €419.3 million of earnings and sees fair value nearer €33.0, and the platform lets you see exactly how those different stories drive different target prices.
Do you think there's more to the story for SPIE? Head over to our Community to see what others are saying!

This article by Simply Wall St is general in nature. We provide commentary based on historical data and analyst forecasts only using an unbiased methodology and our articles are not intended to be financial advice. It does not constitute a recommendation to buy or sell any stock, and does not take account of your objectives, or your financial situation. We aim to bring you long-term focused analysis driven by fundamental data. Note that our analysis may not factor in the latest price-sensitive company announcements or qualitative material. Simply Wall St has no position in any stocks mentioned.
Have feedback on this article? Concerned about the content? Get in touch with us directly. Alternatively, email editorial-team@simplywallst.com