
 Nasdaq
 华尔街日报
华尔街日报Is CNO Financial Group’s Valuation Still Attractive After Its Recent Share Price Pullback?
CNO Financial Group (CNO) has quietly become a steady compounder, doubling investors money over the past 3 years while delivering rising earnings and modest revenue growth in a relatively defensive insurance niche.
See our latest analysis for CNO Financial Group.
At around $41.24 per share, CNO’s recent pullback has been mild compared to its solid year to date share price return. It sits against a backdrop of exceptional three year total shareholder returns that suggest momentum is still broadly intact.
If CNO’s steady compounding appeals to you, this could be a good moment to broaden your radar and explore healthcare stocks that share some of the same defensive characteristics.
With profits growing faster than revenue and shares still trading below some valuation estimates, investors face a key question: is CNO a quietly undervalued compounder, or has the market already priced in its next leg of growth?
Most Popular Narrative: 7.1% Undervalued
With CNO closing at $41.24 against a narrative fair value of $44.40, the story points to modest upside grounded in improving profitability and capital returns.
Strong momentum in digital and web-based direct-to-consumer channels, evidenced by 39% year-over-year growth and over 30% of D2C leads now from digital sources, is reducing customer acquisition costs and is expected to drive further margin expansion and scalability.
Want to see what kind of earnings power this shift could unlock? The narrative leans on rising margins, disciplined buybacks, and a surprisingly conservative future valuation multiple. Curious how those pieces fit together into that fair value call?
Result: Fair Value of $44.40 (UNDERVALUED)
Have a read of the narrative in full and understand what's behind the forecasts.
However, if long term care claims spike or digital competitors outpace CNO’s own transformation, those higher margin and buyback assumptions could unravel quickly.
Find out about the key risks to this CNO Financial Group narrative.
Another Angle on Value
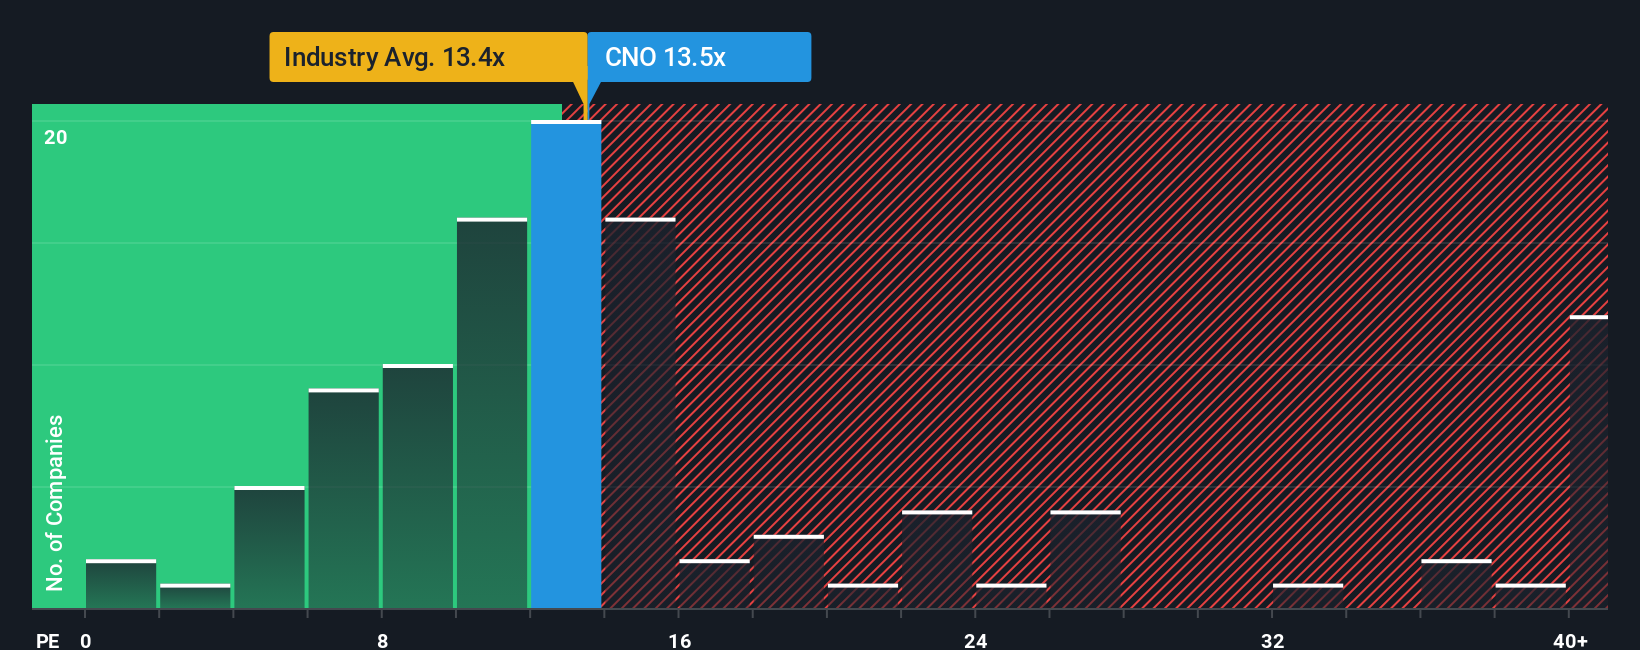
On simple earnings ratios, CNO looks more mixed. It trades at about 13 times earnings, slightly cheaper than the US insurance industry at 13.4 times, but richer than peer averages around 10.1 times. Our fair ratio of 16.4 times hints at upside, yet leaves real room for rerating risk if sentiment sours. How much of that gap would you be comfortable betting on?
See what the numbers say about this price — find out in our valuation breakdown.
Build Your Own CNO Financial Group Narrative
If you see things differently or want to dig into the numbers yourself, you can build a personalized view in just minutes with Do it your way.
A great starting point for your CNO Financial Group research is our analysis highlighting 3 key rewards and 2 important warning signs that could impact your investment decision.
Looking for more investment ideas?
Do not stop at one opportunity, use the Simply Wall St Screener to uncover fresh stocks that match your strategy before the market fully catches on.
- Capture high-upside names early by scanning these 3608 penny stocks with strong financials that already show real financial strength behind their low share prices.
- Position your portfolio at the forefront of innovation by targeting these 26 AI penny stocks shaping the next wave of intelligent software and automation.
- Lock in potential bargains before others notice by focusing on these 903 undervalued stocks based on cash flows where prices lag behind the cash flows powering long term value.
This article by Simply Wall St is general in nature. We provide commentary based on historical data and analyst forecasts only using an unbiased methodology and our articles are not intended to be financial advice. It does not constitute a recommendation to buy or sell any stock, and does not take account of your objectives, or your financial situation. We aim to bring you long-term focused analysis driven by fundamental data. Note that our analysis may not factor in the latest price-sensitive company announcements or qualitative material. Simply Wall St has no position in any stocks mentioned.
Have feedback on this article? Concerned about the content? Get in touch with us directly. Alternatively, email editorial-team@simplywallst.com