
 Nasdaq
 华尔街日报
华尔街日报Is Innodata’s AI Fueled Surge Justified After 1706.9% Three Year Gain?
- If you are wondering whether Innodata is still a smart buy after its huge run, or if most of the upside is already priced in, you are not alone in trying to figure out what this stock is really worth.
- Despite pulling back around 9.3% over the last week and 15.4% over the past month, Innodata is still up an eye catching 32.7% year to date, 51.9% over the last year, and 1706.9% over three years and 927.5% over five years.
- That kind of performance has coincided with growing enthusiasm around AI and data centric service providers, with Innodata often mentioned in discussions about smaller cap ways to gain exposure to the AI infrastructure theme. As attention has shifted toward companies enabling data labeling, model training, and AI driven workflows, sentiment and speculation have both helped drive the share price higher.
- Yet on our checks Innodata only scores 1 out of 6 on valuation, which suggests that the market may already be pricing in a lot of that excitement. Next we will walk through the main valuation methods investors are using and then finish with a more complete way to think about what this stock could really be worth.
Innodata scores just 1/6 on our valuation checks. See what other red flags we found in the full valuation breakdown.
Approach 1: Innodata Discounted Cash Flow (DCF) Analysis
A Discounted Cash Flow model estimates what a company is worth by projecting its future cash flows and then discounting those back to today, to reflect risk and the time value of money.
For Innodata, the model starts with last twelve months free cash flow of about $39.2 Million. It then uses analyst expectations and extrapolations by Simply Wall St to forecast how that cash flow could evolve. By 2026, free cash flow is projected at roughly $27.3 Million, with further declines and modest changes assumed over the following years. This produces a ten year path of cash flows that are each discounted back to their value in today’s dollars.
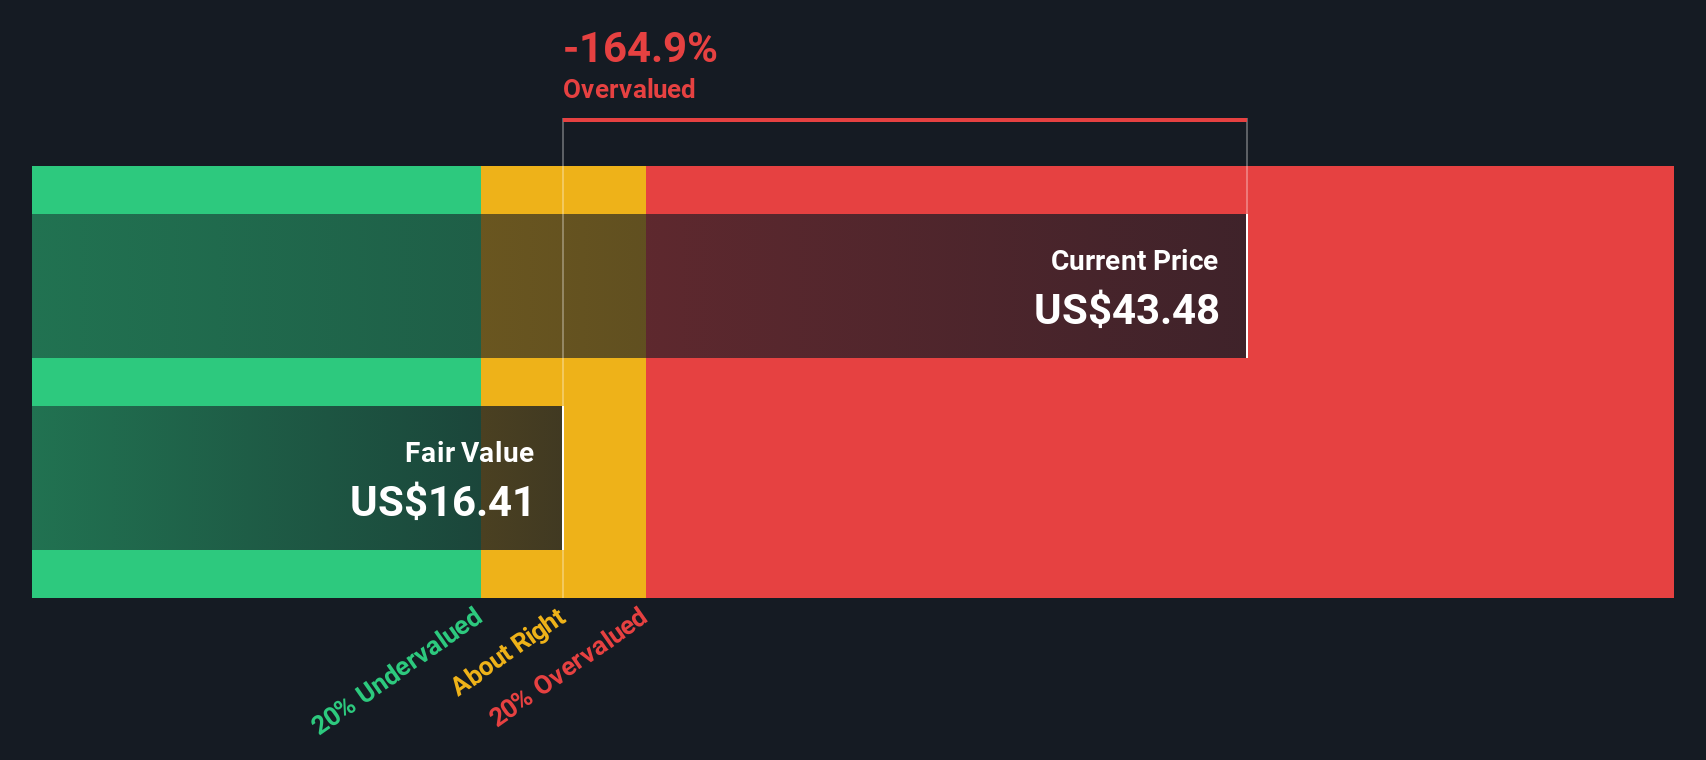
Adding up those discounted cash flows and a terminal value produces an estimated intrinsic value of $12.09 per share using a 2 Stage Free Cash Flow to Equity model. Compared with the current share price, this implies the stock is around 333.4% overvalued, meaning the market is pricing in far more optimistic cash flow growth than this model supports.
Result: OVERVALUED
Our Discounted Cash Flow (DCF) analysis suggests Innodata may be overvalued by 333.4%. Discover 903 undervalued stocks or create your own screener to find better value opportunities.
Approach 2: Innodata Price vs Earnings
For profitable companies like Innodata, the price to earnings (PE) ratio is a useful way to judge valuation because it links what investors pay for each share directly to the earnings that business is generating today. In general, higher expected growth and lower risk justify a higher PE, while slower or more uncertain growth usually deserves a lower, more conservative multiple.
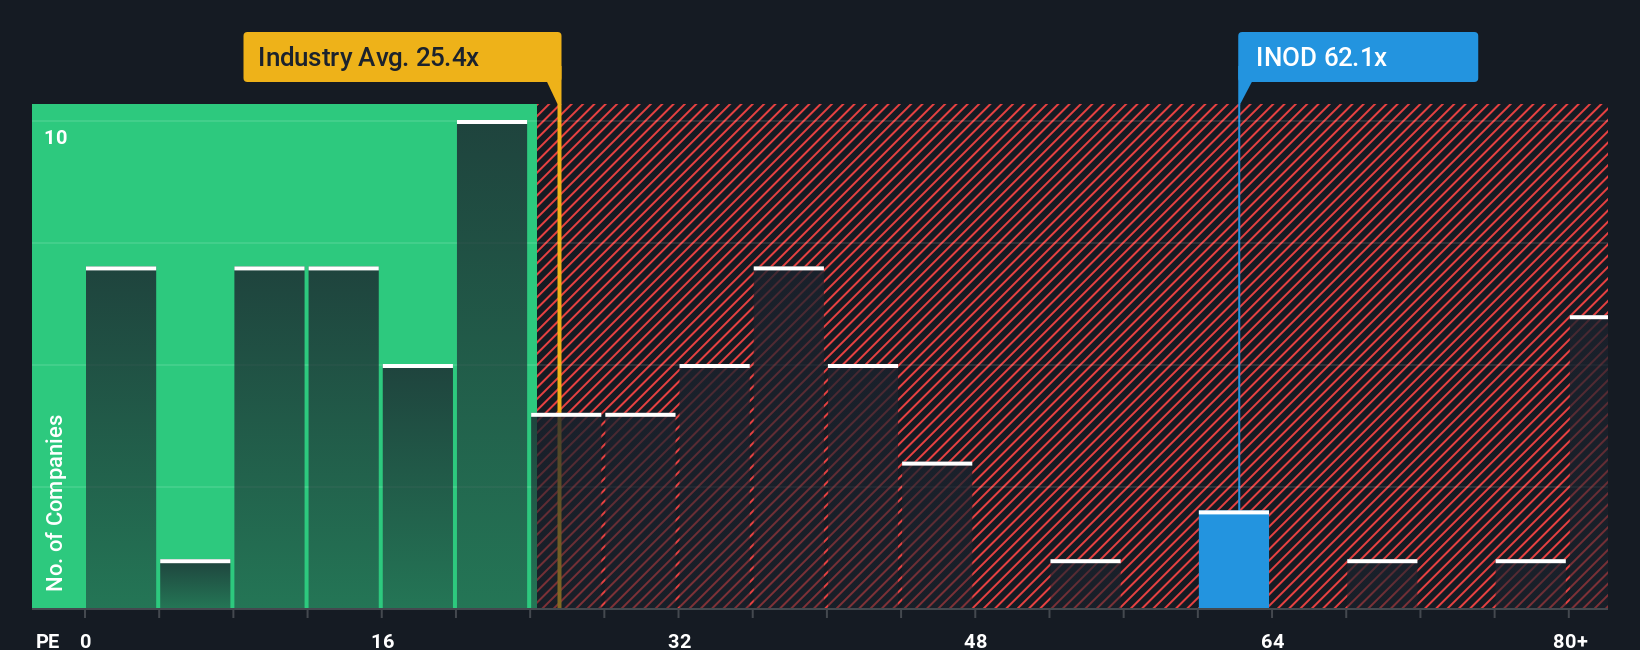
Innodata currently trades on a PE of about 49.6x, well above both the Professional Services industry average of around 25.0x and the peer average of roughly 40.2x. That already suggests a rich valuation relative to similar businesses. Simply Wall St’s proprietary Fair Ratio model, however, goes a step further by estimating what PE Innodata should trade on, given its earnings growth outlook, profitability, industry, size and risk profile. For Innodata, this Fair Ratio is 24.3x, which implies the stock deserves only about half of its present multiple once those fundamentals are considered.
On this basis, Innodata appears meaningfully overvalued, with its actual PE standing well above the Fair Ratio.
Result: OVERVALUED
PE ratios tell one story, but what if the real opportunity lies elsewhere? Discover 1442 companies where insiders are betting big on explosive growth.
Upgrade Your Decision Making: Choose your Innodata Narrative
Earlier we mentioned that there is an even better way to understand valuation. Let us introduce you to Narratives, a simple framework on Simply Wall St’s Community page that lets you connect your story about Innodata with a set of assumptions for its future revenue, earnings and margins. This turns that story into a financial forecast, a fair value and a clear buy or sell signal by comparing that fair value to today’s price. All of this then updates dynamically as new news or earnings arrive. Two investors might look at Innodata’s AI opportunity and, using the same tools, one could build a bullish Narrative that supports a fair value near $110, while another, more cautious about customer concentration and automation risk, might land closer to $55. This gives you a concrete, number backed way to decide which version of the future you believe and how to act on it.
Do you think there's more to the story for Innodata? Head over to our Community to see what others are saying!

This article by Simply Wall St is general in nature. We provide commentary based on historical data and analyst forecasts only using an unbiased methodology and our articles are not intended to be financial advice. It does not constitute a recommendation to buy or sell any stock, and does not take account of your objectives, or your financial situation. We aim to bring you long-term focused analysis driven by fundamental data. Note that our analysis may not factor in the latest price-sensitive company announcements or qualitative material. Simply Wall St has no position in any stocks mentioned.
Have feedback on this article? Concerned about the content? Get in touch with us directly. Alternatively, email editorial-team@simplywallst.com