
 Nasdaq
 华尔街日报
华尔街日报Is Western Alliance Still Attractive After Its Rebound And Reassessment Of Regional Banks?
- Wondering if Western Alliance Bancorporation is still a bargain after its rebound, or if most of the easy upside is already priced in, you are not alone.
- The stock now trades around $87.59, up 2.6% over the last week and 8.9% over the past month, while still roughly flat over the last year but up more than 60% over three years.
- Recently, investors have been reassessing regional banks in light of shifting interest rate expectations and renewed confidence in balance sheet strength, and Western Alliance has been part of that broader narrative. There has also been ongoing attention on how management is positioning the bank in key growth markets such as commercial and technology lending, which helps explain some of the renewed buying interest.
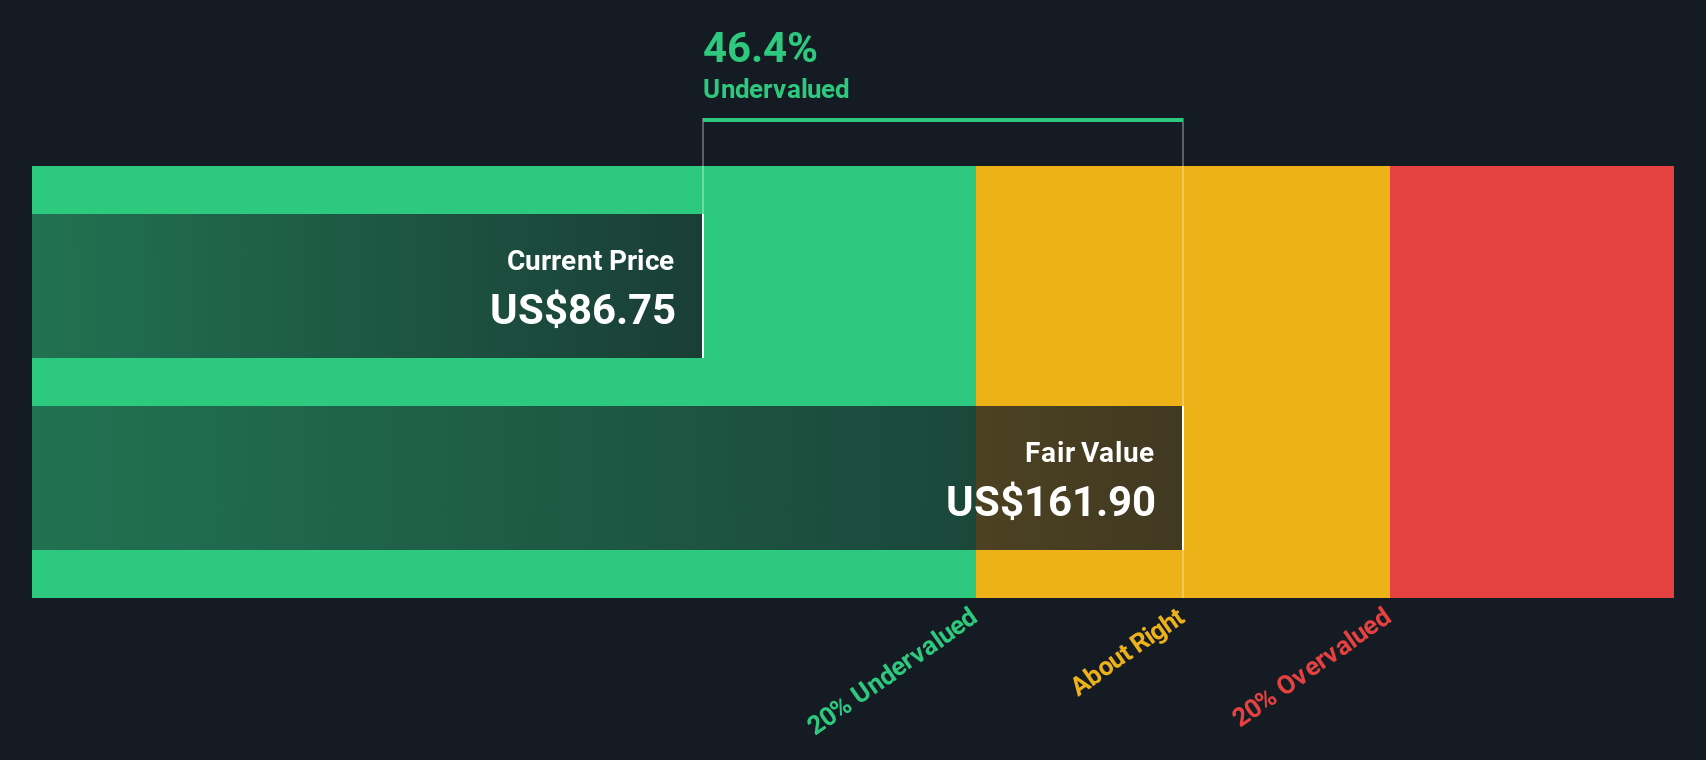
- On our valuation framework, Western Alliance scores a solid 5/6 for being undervalued on multiple checks. Next we will unpack what different valuation methods are saying about the stock today, before finishing with a more holistic way to think about its true worth.
Approach 1: Western Alliance Bancorporation Excess Returns Analysis
The Excess Returns model estimates what Western Alliance Bancorporation can earn on its equity above the return investors require, and then capitalizes those extra profits into an intrinsic value per share.
Analysts expect the bank to maintain a solid profitability profile, with Stable EPS of $10.84 per share, based on weighted future Return on Equity estimates from 13 analysts. Against a Cost of Equity of $6.20 per share, this implies an Excess Return of $4.64 per share, suggesting Western Alliance is generating meaningfully more than investors are demanding for the risk they are taking.
The model also assumes Book Value of $65.26 per share rising toward a Stable Book Value of $75.75 per share, based on forecasts from 9 analysts. Combined with an average expected Return on Equity of 14.31%, these inputs support a robust Excess Returns profile that drives a materially higher intrinsic value than today’s price implies.
On this basis, the Excess Returns valuation points to an intrinsic value around $169.79 per share, indicating the stock is roughly 48.4% undervalued versus the current market price.
Result: UNDERVALUED
Our Excess Returns analysis suggests Western Alliance Bancorporation is undervalued by 48.4%. Track this in your watchlist or portfolio, or discover 907 more undervalued stocks based on cash flows.
Approach 2: Western Alliance Bancorporation Price vs Earnings
For a consistently profitable bank like Western Alliance, the price to earnings, or PE, ratio is a useful yardstick because it links what investors pay today to the earnings the business is already generating. In general, faster earnings growth and lower risk justify a higher “normal” PE, while slower growth or higher uncertainty point to a lower one.
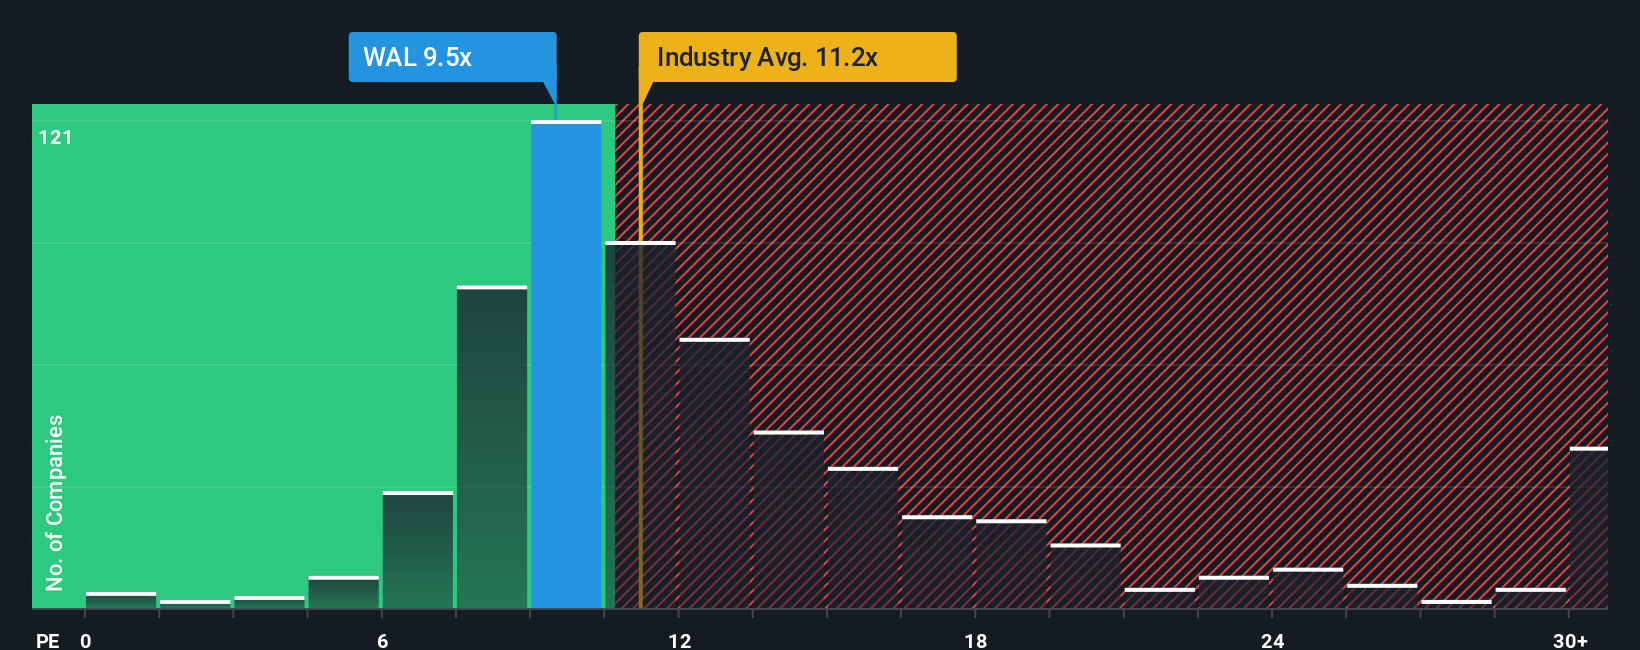
Western Alliance currently trades on a PE of about 10.7x. That sits just below the broader Banks industry average of roughly 11.9x, and at a discount to its closest peers, which are around 14.2x. Simply Wall St’s “Fair Ratio” framework goes a step further by estimating what PE investors might reasonably pay once you factor in Western Alliance’s specific earnings growth outlook, profitability, risk profile, industry and market cap. On this basis, Western Alliance’s Fair Ratio is 15.8x, noticeably higher than both its current multiple and the peer group.
Because the Fair Ratio incorporates company specific strengths and risks, it offers a more tailored benchmark than simple peer or industry comparisons. With the shares trading well below that 15.8x Fair Ratio, the PE perspective suggests Western Alliance still looks attractively priced.
Result: UNDERVALUED
PE ratios tell one story, but what if the real opportunity lies elsewhere? Discover 1448 companies where insiders are betting big on explosive growth.
Upgrade Your Decision Making: Choose your Western Alliance Bancorporation Narrative
Earlier we mentioned that there is an even better way to understand valuation, so let us introduce you to Narratives, which are simply your story about Western Alliance Bancorporation, translated into a set of numbers like future revenue, earnings, margins and a fair value estimate. A Narrative connects three pieces together: the business story, a financial forecast, and then a fair value that you can compare with today’s share price to decide whether you think the stock is a buy, hold or sell. On Simply Wall St’s Community page, used by millions of investors, Narratives are an easy, accessible tool. You pick your assumptions, the platform builds the forecast, and it instantly shows how your fair value stacks up against the current price. Because Narratives are updated dynamically when new information like earnings results, guidance or major news hits, your view of Western Alliance does not stay static or get stale. For example, one investor might plug in strong loan growth, rising margins and arrive at a fair value near the top of the current target range around $105, while a more cautious investor focused on credit and legal risks might assume slower growth and lower multiples, landing closer to $85 instead.
Do you think there's more to the story for Western Alliance Bancorporation? Head over to our Community to see what others are saying!

This article by Simply Wall St is general in nature. We provide commentary based on historical data and analyst forecasts only using an unbiased methodology and our articles are not intended to be financial advice. It does not constitute a recommendation to buy or sell any stock, and does not take account of your objectives, or your financial situation. We aim to bring you long-term focused analysis driven by fundamental data. Note that our analysis may not factor in the latest price-sensitive company announcements or qualitative material. Simply Wall St has no position in any stocks mentioned.
Have feedback on this article? Concerned about the content? Get in touch with us directly. Alternatively, email editorial-team@simplywallst.com