
 Nasdaq
 华尔街日报
华尔街日报Is There Still Opportunity in Genmab After its Strong 2025 Share Price Rally?
- If you are wondering whether Genmab is still a smart buy after its big run or if most of the upside is already priced in, this breakdown will help you assess whether the current share price reflects its long term potential.
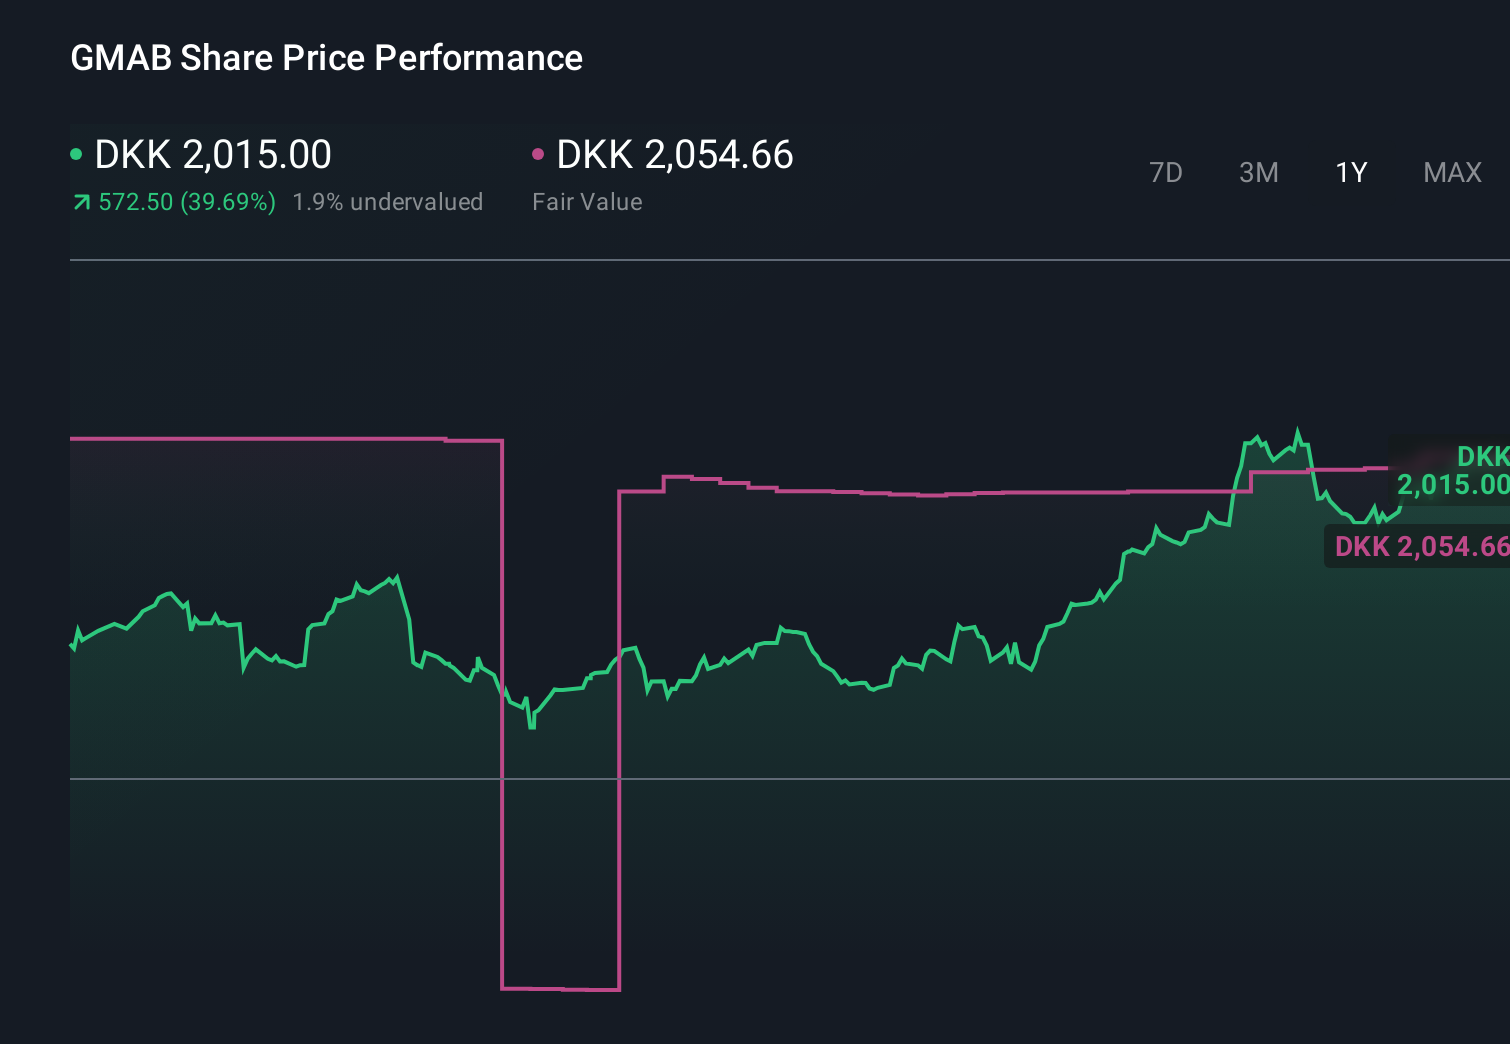
- The stock is up 31.6% year to date and 40.1% over the last year, despite only modest moves of 2.5% over 30 days and a slight 0.8% dip in the last week. This suggests sentiment has improved even though the longer 3 and 5 year returns are still negative.
- Recently, Genmab has remained in the spotlight thanks to ongoing progress across its antibody pipeline and high profile partnerships in oncology that keep investors focused on its long term growth story. At the same time, shifting risk appetite in biotech and renewed interest in innovative cancer therapies have helped support the share price as investors reassess what level of growth they are willing to pay for.
- On our valuation checklist, Genmab scores a solid 5 out of 6 for being undervalued, which suggests the market may still be underestimating some of its strengths. Next, we will walk through how different valuation methods compare for Genmab and then finish with an additional way to think about what the stock may be worth over time.
Approach 1: Genmab Discounted Cash Flow (DCF) Analysis
A Discounted Cash Flow model estimates what a company is worth today by projecting the cash it can generate in the future and then discounting those cash flows back to their value in today’s dollars.
For Genmab, the latest twelve month Free Cash Flow is about $1.30 billion. Analysts expect this to grow meaningfully over the next several years, with projections rising to around $2.32 billion by 2029. Beyond the explicit analyst horizon, Simply Wall St extrapolates further free cash flow growth using a 2 Stage Free Cash Flow to Equity model, which assumes stronger growth in the near term that gradually normalizes over the longer term.
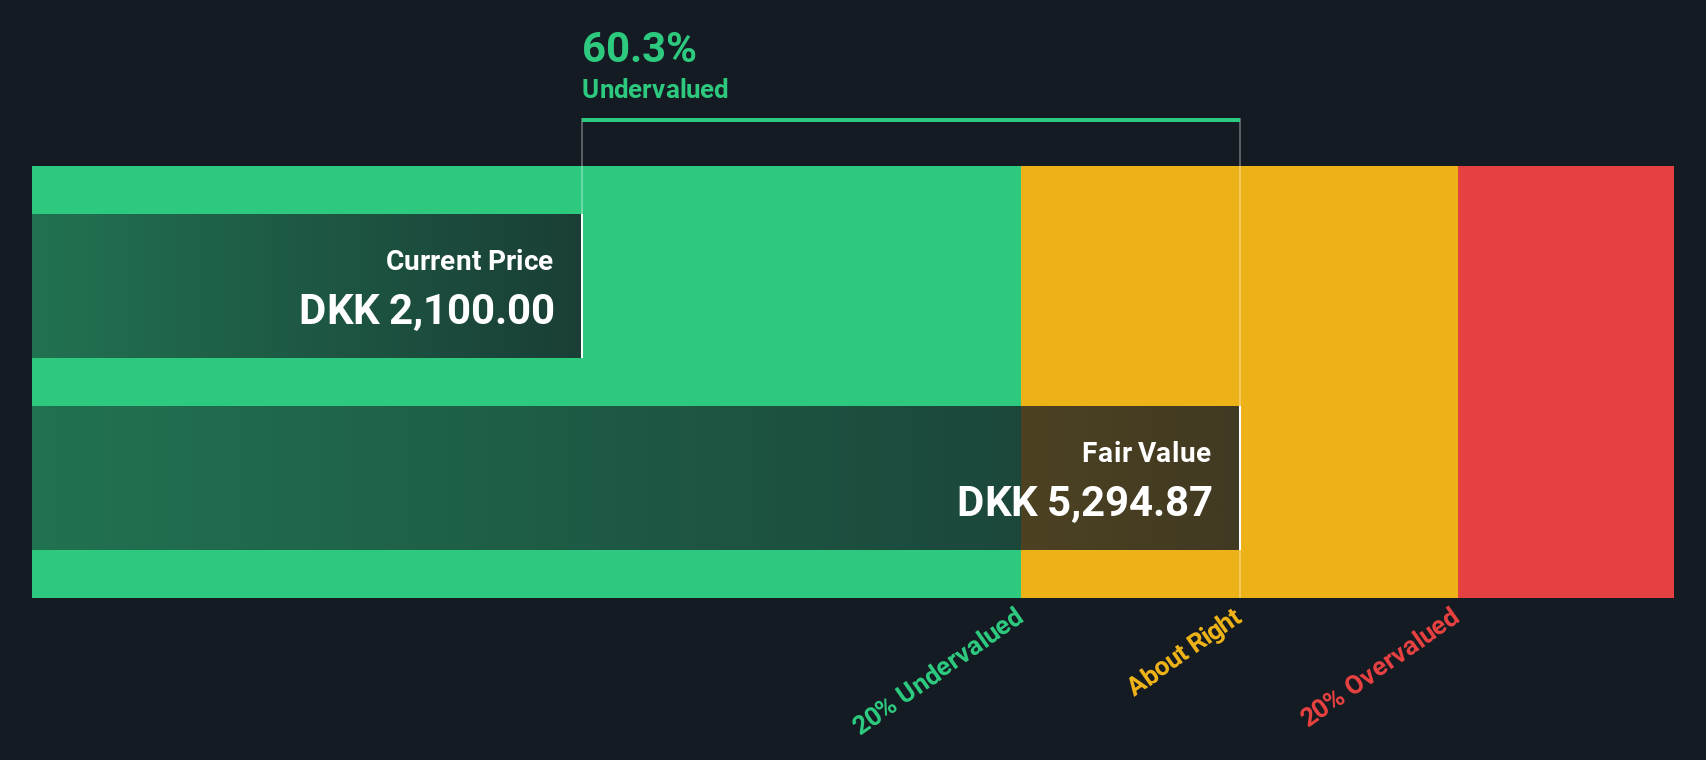
When all of these projected cash flows are discounted back, the model produces an estimated intrinsic value of roughly $5,588 per share. Compared with the current market price, this implies the stock is about 63.9% undervalued, indicating that the market may not be fully pricing in Genmab’s future cash generation.
Result: UNDERVALUED
Our Discounted Cash Flow (DCF) analysis suggests Genmab is undervalued by 63.9%. Track this in your watchlist or portfolio, or discover 907 more undervalued stocks based on cash flows.
Approach 2: Genmab Price vs Earnings
For profitable companies like Genmab, the Price to Earnings ratio is a useful way to gauge how much investors are willing to pay today for each unit of current earnings. Higher growth and lower perceived risk usually justify a higher PE ratio, while slower or uncertain growth, or elevated risk, typically calls for a lower one.
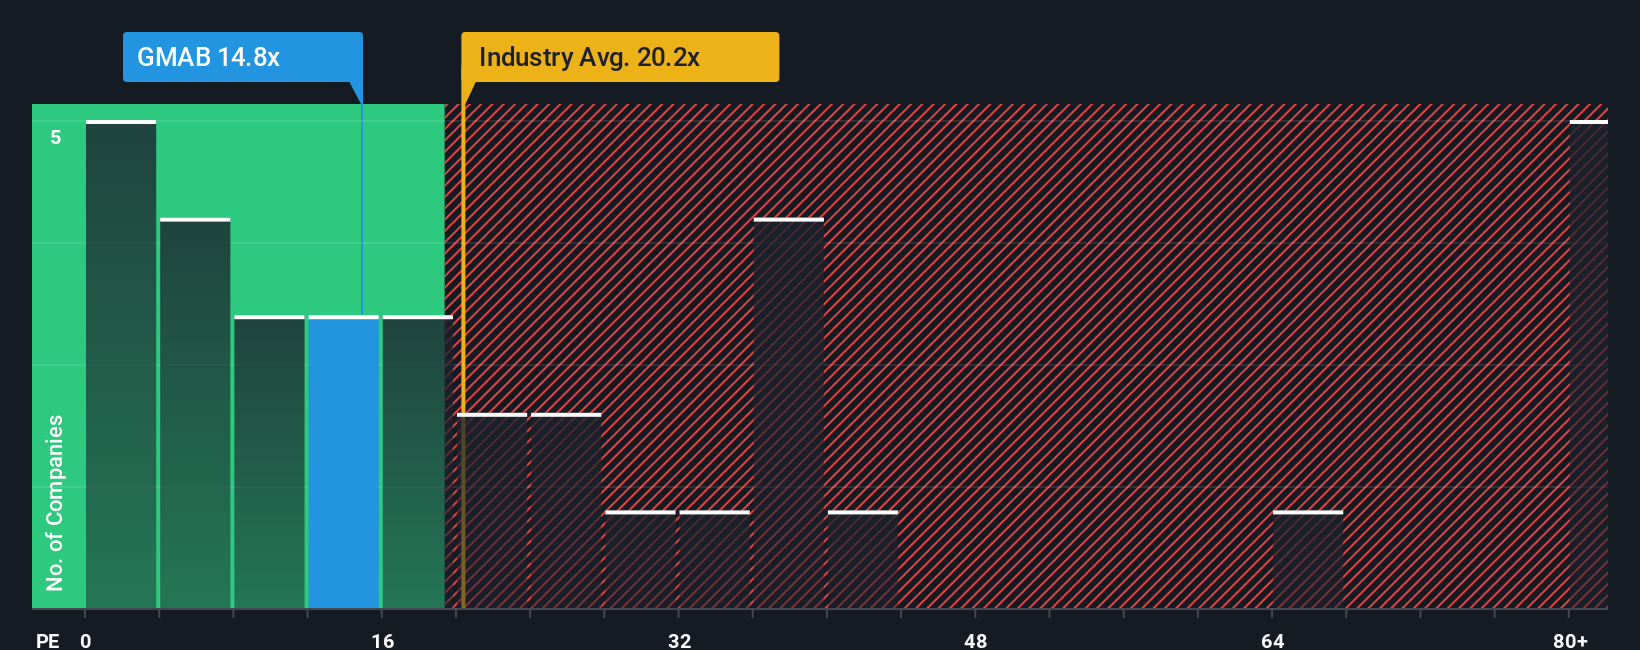
Genmab currently trades on a PE of about 12.3x, which is well below both the Biotechs industry average of around 27.9x and the peer group average of roughly 16.9x. Simply Wall St also calculates a proprietary Fair Ratio of 18.9x, which reflects what Genmab’s PE might reasonably be given its earnings growth profile, profitability, industry positioning, market value and specific risk factors.
This Fair Ratio is more informative than a simple comparison with peers or the broad industry, because it adjusts for Genmab’s own growth outlook, margins and risk, rather than assuming all companies deserve the same rating. With the current 12.3x PE sitting notably below the 18.9x Fair Ratio, the multiple based view also points to Genmab being undervalued.
Result: UNDERVALUED
PE ratios tell one story, but what if the real opportunity lies elsewhere? Discover 1448 companies where insiders are betting big on explosive growth.
Upgrade Your Decision Making: Choose your Genmab Narrative
Earlier we mentioned that there is an even better way to understand valuation. Let us introduce you to Narratives, a simple framework on Simply Wall St’s Community page. Here, you describe your story for Genmab, translate that story into assumptions for revenue, earnings and margins, and then see how that flows through into a forecast, a fair value and finally a clear buy or sell view by comparing Fair Value to today’s Price. The whole Narrative updates dynamically as news, guidance or earnings arrive. For example, a bullish investor might build a Narrative around rapid oncology adoption and assign a fair value closer to around DKK 2,650 per share. A more cautious investor, worried about pricing pressure and pipeline risk, may land nearer DKK 1,000. Both use the same structured tool to turn their perspective into numbers they can act on.
Do you think there's more to the story for Genmab? Head over to our Community to see what others are saying!
This article by Simply Wall St is general in nature. We provide commentary based on historical data and analyst forecasts only using an unbiased methodology and our articles are not intended to be financial advice. It does not constitute a recommendation to buy or sell any stock, and does not take account of your objectives, or your financial situation. We aim to bring you long-term focused analysis driven by fundamental data. Note that our analysis may not factor in the latest price-sensitive company announcements or qualitative material. Simply Wall St has no position in any stocks mentioned.
Have feedback on this article? Concerned about the content? Get in touch with us directly. Alternatively, email editorial-team@simplywallst.com