
 Nasdaq
 华尔街日报
华尔街日报Is Ferrari’s Recent Share Price Slide Creating a Compelling Long Term Opportunity?
- If you have been wondering whether Ferrari is starting to look like a bargain after its slide, you are not alone. Let us unpack what the recent price action really means for long term, value focused investors.
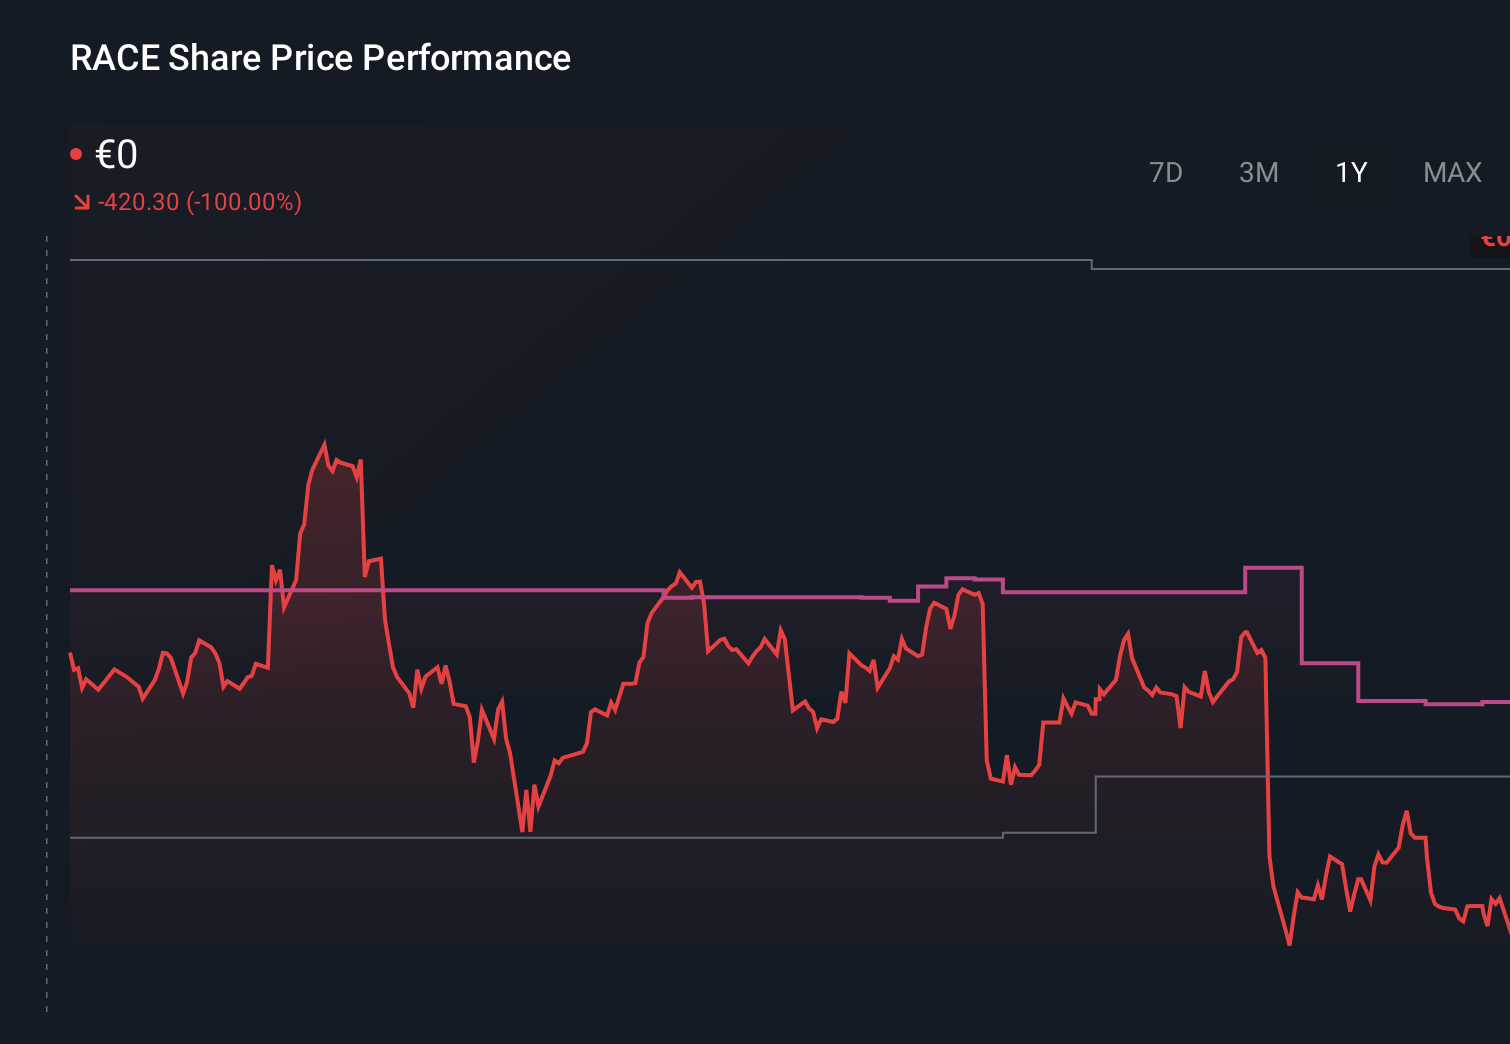
- The share price has pulled back sharply, down about 8% over the last week, 15.1% over the past month, and 23.5% year to date, even though it is still up 54.9% over three years and 75.8% over five. This profile suggests a re rating rather than a broken story.
- Recent headlines have focused on Ferrari doubling down on its luxury positioning and long term electrification roadmap, reinforcing the idea that it is more of a high end brand compounding machine than a typical cyclical automaker. At the same time, investors have been debating whether rich valuations for quality growth names can hold up in a more volatile macro backdrop, and Ferrari has been caught in that crossfire.
- Right now our valuation framework gives Ferrari a score of 1 out of 6 on undervaluation checks, which suggests the market is still pricing it as a premium franchise. In the next sections we will walk through different valuation lenses and then finish with a more intuitive way to tie those numbers back to the real investment story.
Ferrari scores just 1/6 on our valuation checks. See what other red flags we found in the full valuation breakdown.
Approach 1: Ferrari Discounted Cash Flow (DCF) Analysis
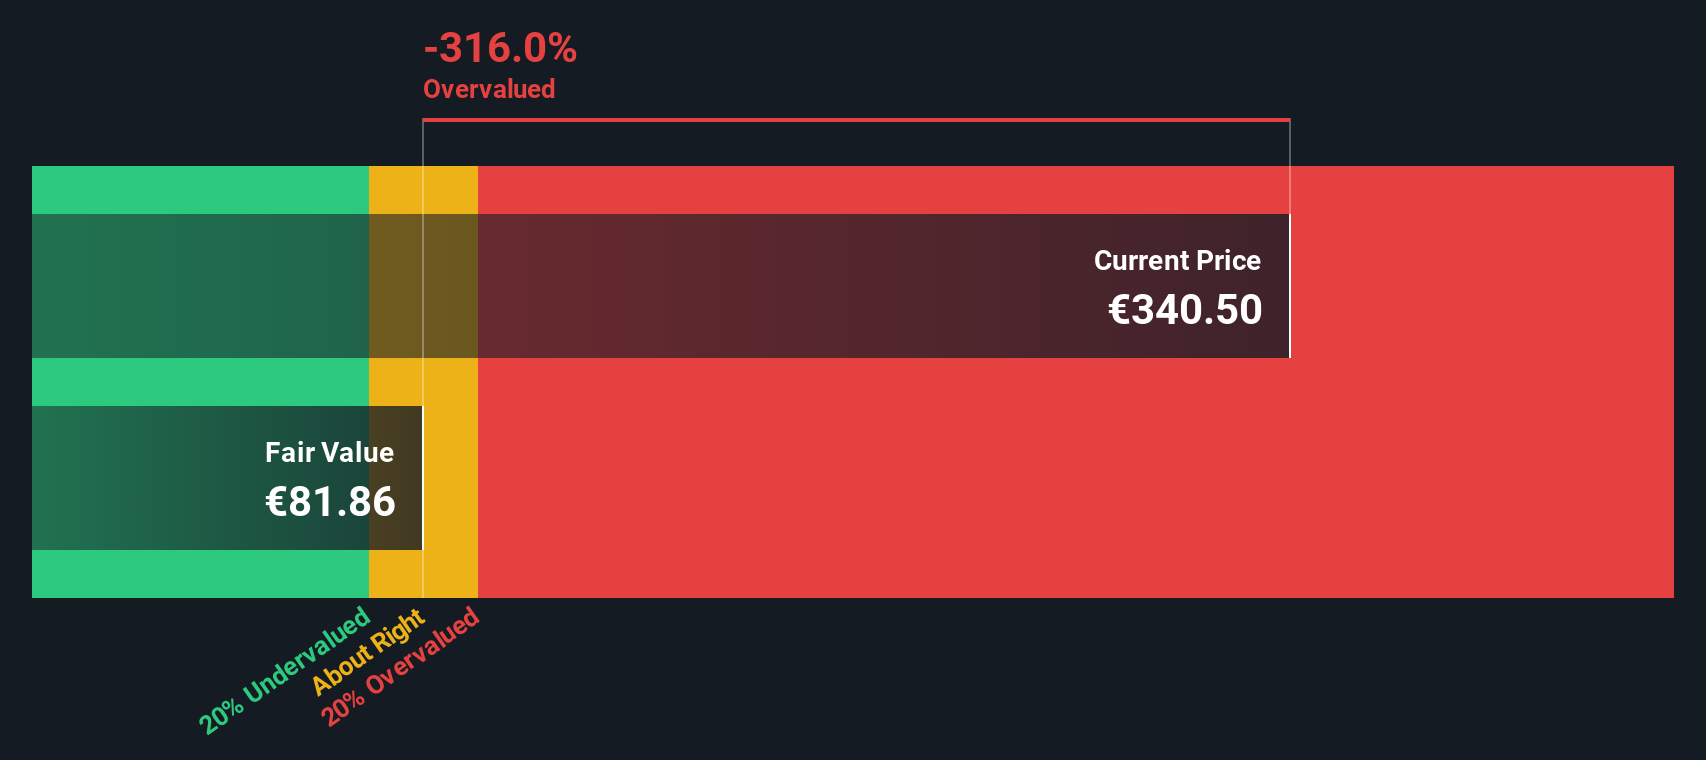
A Discounted Cash Flow model estimates what a business is worth by projecting its future cash flows and discounting them back to today in € terms. For Ferrari, the model starts from last twelve month free cash flow of about €1.28 billion and then applies a 2 stage Free Cash Flow to Equity approach.
Analysts provide detailed forecasts for the next few years, with free cash flow expected to rise toward roughly €2.0 billion by 2029. Beyond that, Simply Wall St extrapolates cash flows out to 2035, gradually slowing the growth rate to reflect a more mature luxury franchise rather than an early stage growth story.
When all those projected cash flows are discounted back to today, the DCF model arrives at an intrinsic value of about €93.81 per share. Compared with the current market price, this implies Ferrari is roughly 233.9% overvalued. This suggests investors are paying a substantial premium over the cash flow based estimate of fair value.
Result: OVERVALUED
Our Discounted Cash Flow (DCF) analysis suggests Ferrari may be overvalued by 233.9%. Discover 907 undervalued stocks or create your own screener to find better value opportunities.
Approach 2: Ferrari Price vs Earnings
For a profitable, mature business like Ferrari, the price to earnings ratio is a natural way to think about value because it directly links what investors pay today to the profits the company is already generating. In general, faster growth and lower perceived risk justify a higher PE, while slower, more uncertain earnings should command a lower multiple.
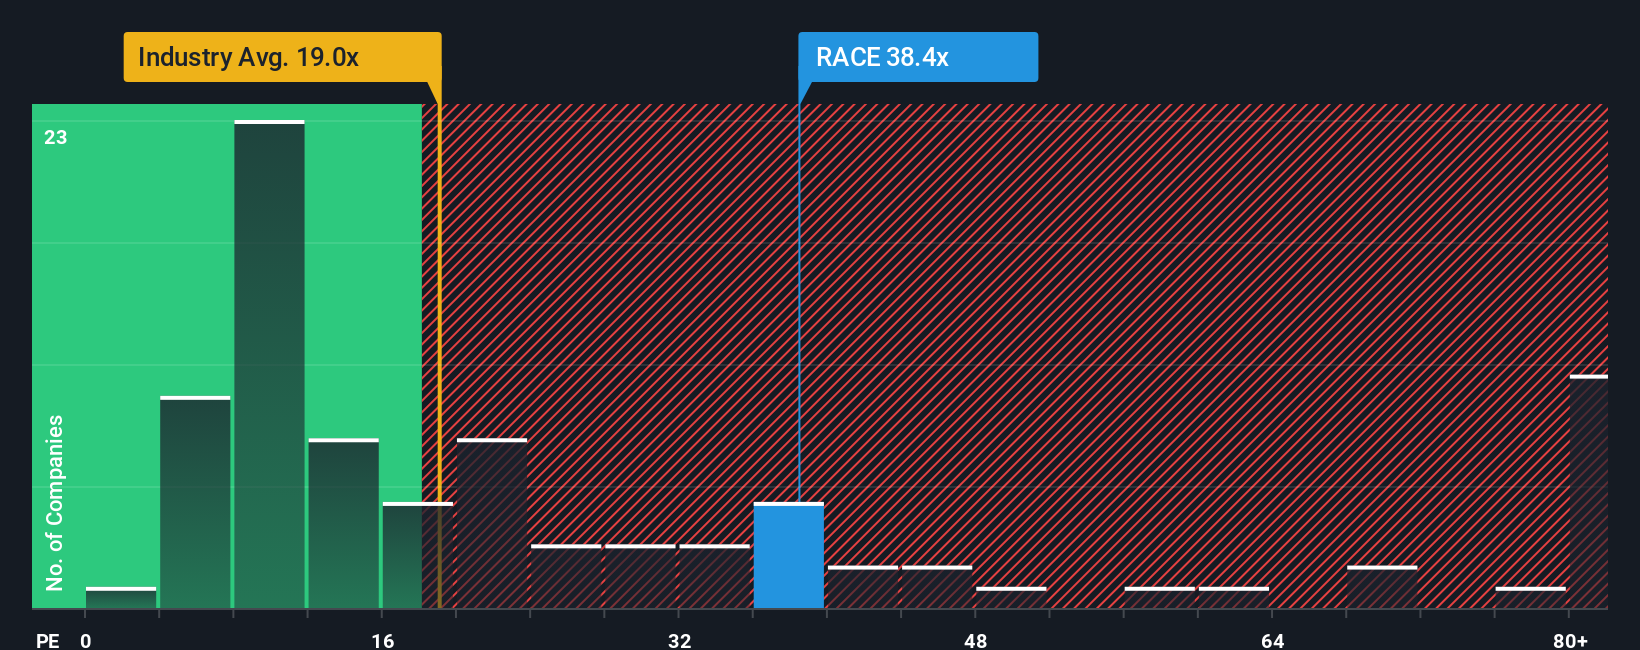
Ferrari currently trades at about 34.7x earnings, well above the Auto industry average of around 18.7x and the peer average of roughly 16.9x. Simply Wall St also calculates a Fair Ratio of 19.8x for Ferrari, which is the PE you might expect given its specific mix of earnings growth, margins, industry, size and risk profile.
This Fair Ratio framework is more informative than a simple peer or industry comparison because it adjusts for company level fundamentals rather than assuming all automakers deserve similar multiples. Lining up the numbers, Ferrari’s actual PE of 34.7x sits meaningfully above the 19.8x Fair Ratio, which indicates the stock is still priced at a rich premium even after the recent pullback.
Result: OVERVALUED
PE ratios tell one story, but what if the real opportunity lies elsewhere? Discover 1448 companies where insiders are betting big on explosive growth.
Upgrade Your Decision Making: Choose your Ferrari Narrative
Earlier we mentioned that there is an even better way to understand valuation, so let us introduce you to Narratives, a simple way to turn your view of Ferrari into a clear story that connects assumptions about future revenue, earnings, margins and risk to a financial forecast, a fair value, and ultimately an investment decision. This is all available inside an easy to use tool on Simply Wall St’s Community page that millions of investors already use. Your Narrative is automatically updated when new news or earnings arrive. For example, one bullish Ferrari investor might build a Narrative around €9.0 billion in 2030 revenue, at least 30% EBIT margins and a fair value near the top analyst target of about €548. A more cautious investor might anchor on slower growth, margin pressure and a fair value closer to €380. Both can then compare their Fair Value to today’s share price to decide whether Ferrari looks like a buy, a hold or a sell.
Do you think there's more to the story for Ferrari? Head over to our Community to see what others are saying!
This article by Simply Wall St is general in nature. We provide commentary based on historical data and analyst forecasts only using an unbiased methodology and our articles are not intended to be financial advice. It does not constitute a recommendation to buy or sell any stock, and does not take account of your objectives, or your financial situation. We aim to bring you long-term focused analysis driven by fundamental data. Note that our analysis may not factor in the latest price-sensitive company announcements or qualitative material. Simply Wall St has no position in any stocks mentioned.
Have feedback on this article? Concerned about the content? Get in touch with us directly. Alternatively, email editorial-team@simplywallst.com