
 Nasdaq
 华尔街日报
华尔街日报Assessing Capricor Therapeutics After a 343% Surge and Bullish DCF Valuation Estimate
- If you have been wondering whether Capricor Therapeutics is still a smart buy after its big run, you are not alone. This stock has quickly moved from under the radar to front and center on a lot of watchlists.
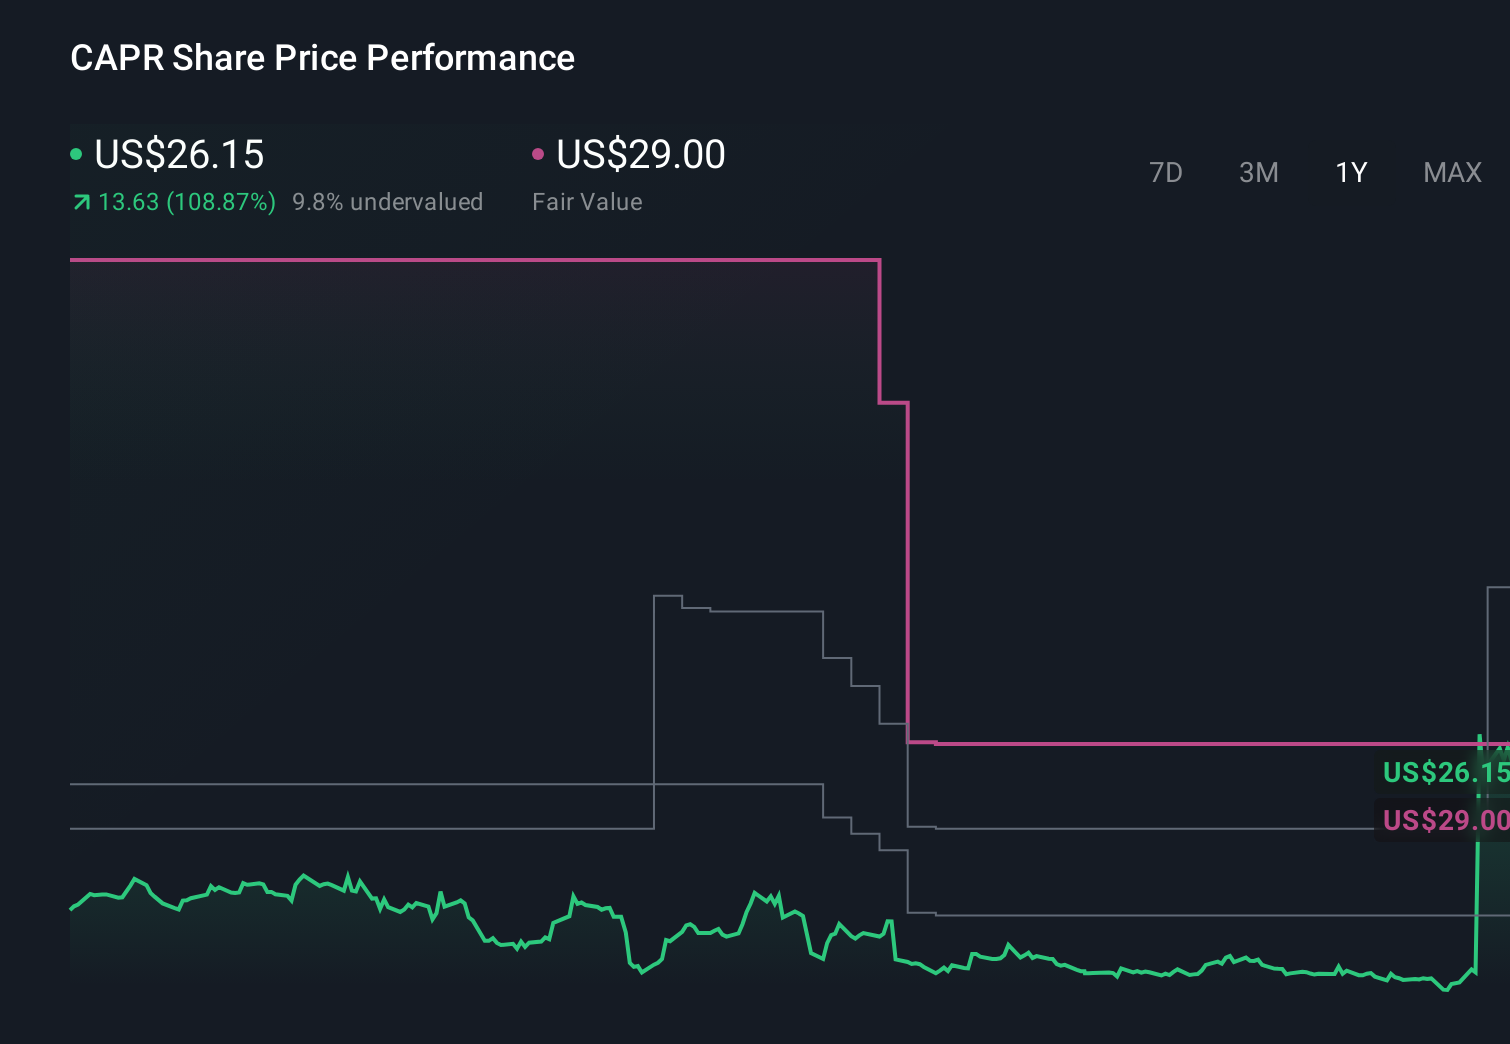
- The share price has dipped 3.2% over the last week, but that small pullback sits on top of a 343.3% gain in the last month and a 96.2% return over the past year, with long term holders still up 593.9% over 3 years and 524.0% over 5 years.
- Behind those moves, investors have been reacting to a steady stream of clinical and partnership updates that have sharpened the market's view on Capricor's pipeline and commercial potential. At the same time, shifting sentiment toward small cap biotech has amplified every piece of good or bad news, turning the stock into a high conviction, high volatility story.
- Even after that surge, Capricor only scores 3 out of 6 on our valuation checks. This means half of the metrics still flag it as potentially undervalued and half suggest caution. Next, we will unpack what different valuation approaches say about the stock and then finish with a more nuanced way to think about its true worth.
Approach 1: Capricor Therapeutics Discounted Cash Flow (DCF) Analysis
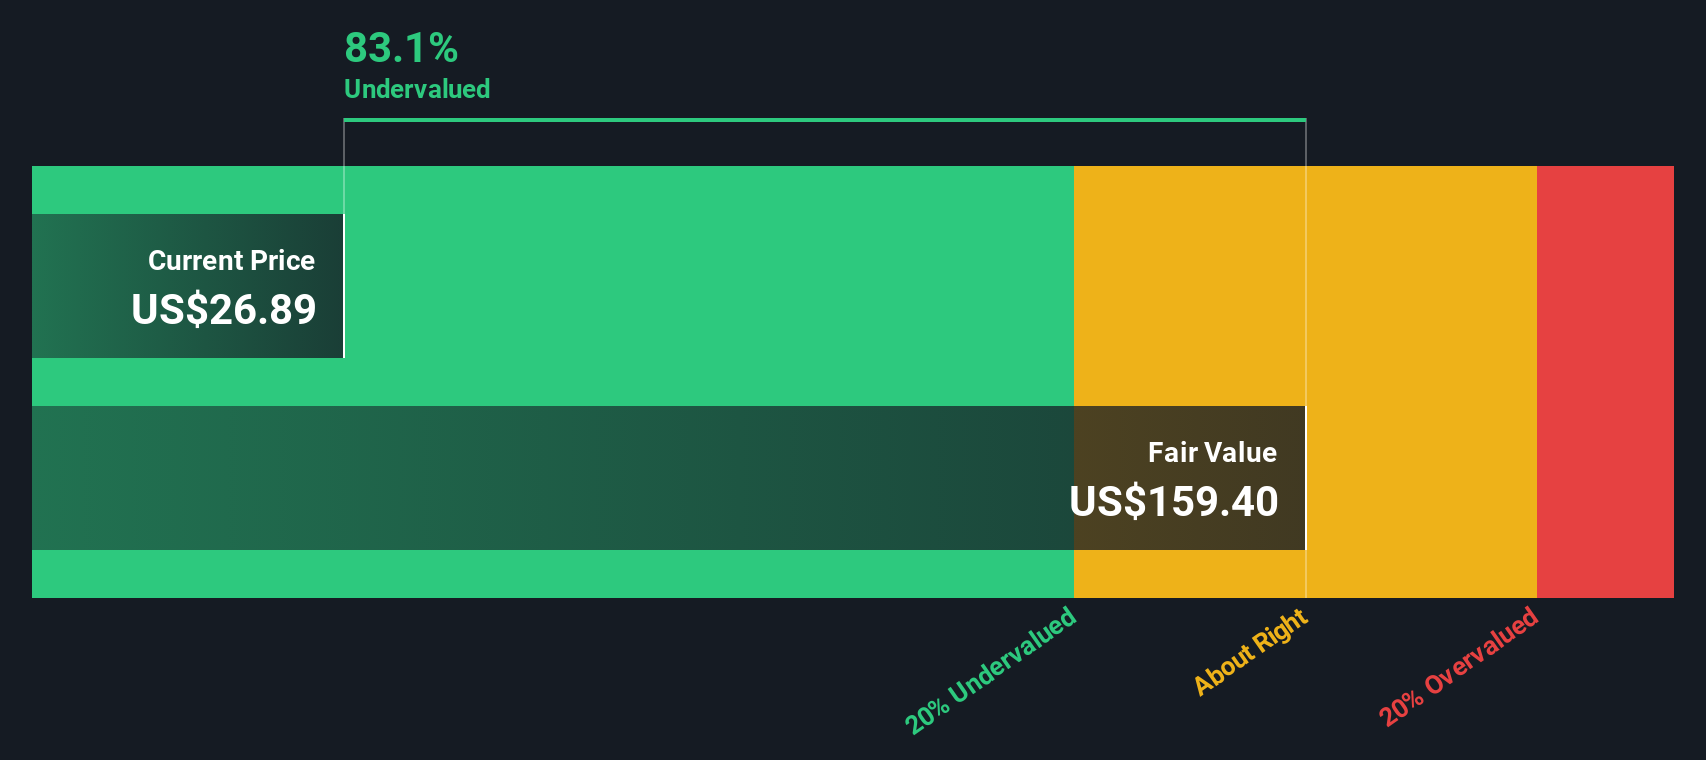
A Discounted Cash Flow model estimates what a company is worth by projecting its future cash flows and then discounting them back to today in dollar terms. For Capricor Therapeutics, the model starts from last twelve month free cash flow of about $63.7 million outflow, reflecting heavy investment and limited current commercial scale.
Analysts and internal estimates see this picture changing markedly, with free cash flow forecast to swing positive from 2026 and rise to around $431.6 million by 2035, based on a mix of analyst projections through 2029 and longer term growth assumptions thereafter. These cash flows are then discounted under a 2 Stage Free Cash Flow to Equity framework, which captures an initial high growth phase followed by a more mature period.
On this basis, the DCF model produces an estimated intrinsic value of about $125.14 per share. That implies the stock trades at roughly a 79.2% discount to its calculated fair value, indicating a wide difference between the current market price and this model-based estimate.
Result: UNDERVALUED
Our Discounted Cash Flow (DCF) analysis suggests Capricor Therapeutics is undervalued by 79.2%. Track this in your watchlist or portfolio, or discover 907 more undervalued stocks based on cash flows.
Approach 2: Capricor Therapeutics Price vs Book
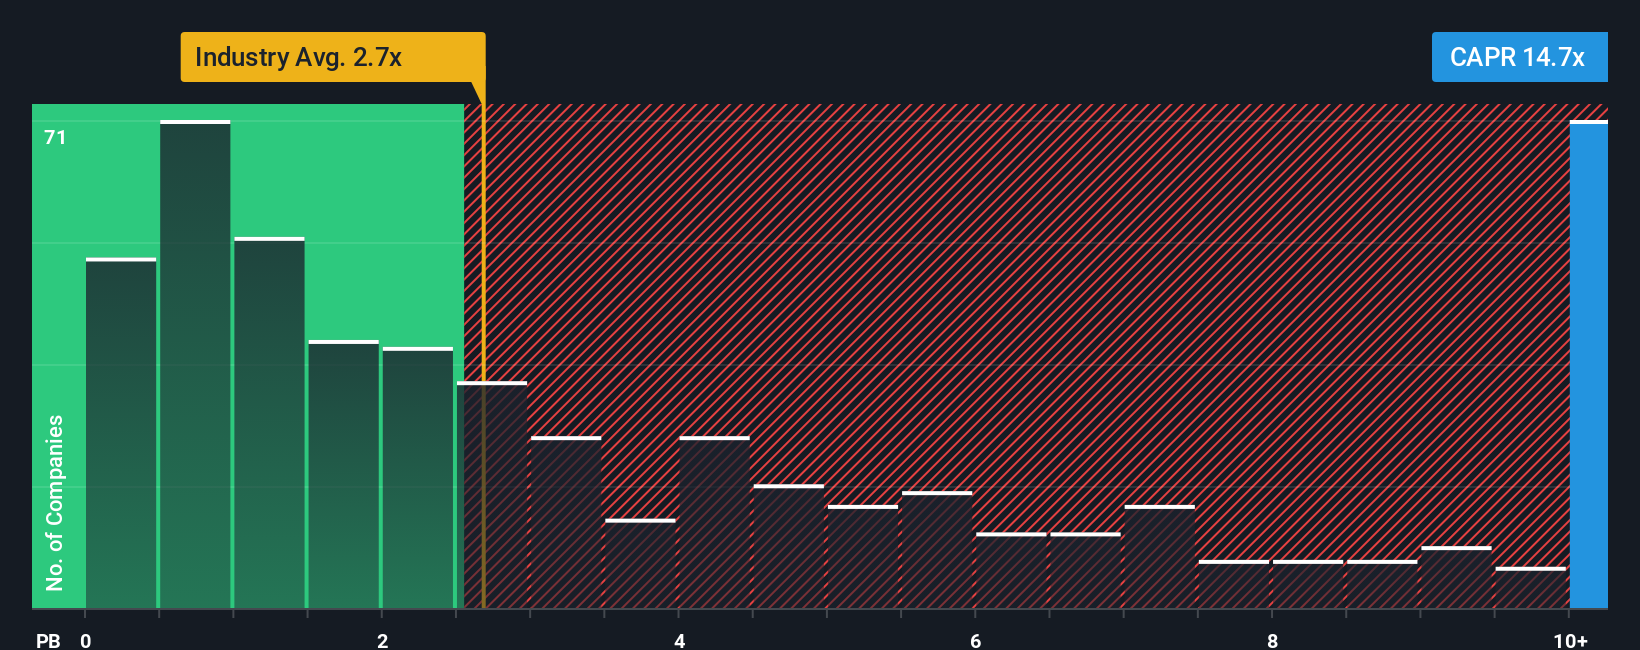
For companies that are still building toward sustained profitability, price to book is often a more grounded valuation tool because it anchors the share price to the net assets that investors are effectively buying today. Investors typically accept a higher or lower price to book depending on how fast a business is expected to grow and how risky that growth appears to be, so growth expectations and risk profile heavily influence what feels like a normal or fair multiple.
Capricor currently trades at about 17.91x book value, far above the Biotechs industry average of roughly 2.69x and the peer group average of about 4.42x. Rather than relying solely on those blunt comparisons, Simply Wall St uses a Fair Ratio, a proprietary estimate of what a reasonable price to book should be once factors like expected growth, profitability, risk, industry dynamics and market cap are taken into account. Because this Fair Ratio is tailored to Capricor’s specific profile, it is a more precise yardstick than simple peer or industry averages. With the stock’s actual 17.91x multiple sitting well above our Fair Ratio estimate, Capricor screens as materially overvalued on this metric.
Result: OVERVALUED
PB ratios tell one story, but what if the real opportunity lies elsewhere? Discover 1448 companies where insiders are betting big on explosive growth.
Upgrade Your Decision Making: Choose your Capricor Therapeutics Narrative
Earlier we mentioned that there is an even better way to understand valuation. Let us introduce you to Narratives, which are clear, easy to follow stories that connect your view of Capricor Therapeutics future revenue, earnings and margins to a concrete forecast and Fair Value. You can then compare that to today’s Price to help guide investment decisions, all inside the Narratives tool on Simply Wall St’s Community page that millions of investors use. Each Narrative is kept up to date as new news or earnings arrive. For example, one bullish Capricor Narrative might assume strong HOPE 3 data and sustained rare disease pricing to justify a Fair Value near the high end of recent targets around $44.56. A more cautious Narrative might focus on regulatory and concentration risk and land closer to the low end near $12. This gives you a dynamic, side by side view of how different stories about the same company translate into very different valuations.
Do you think there's more to the story for Capricor Therapeutics? Head over to our Community to see what others are saying!
This article by Simply Wall St is general in nature. We provide commentary based on historical data and analyst forecasts only using an unbiased methodology and our articles are not intended to be financial advice. It does not constitute a recommendation to buy or sell any stock, and does not take account of your objectives, or your financial situation. We aim to bring you long-term focused analysis driven by fundamental data. Note that our analysis may not factor in the latest price-sensitive company announcements or qualitative material. Simply Wall St has no position in any stocks mentioned.
Have feedback on this article? Concerned about the content? Get in touch with us directly. Alternatively, email editorial-team@simplywallst.com