
 Nasdaq
 华尔街日报
华尔街日报Estimating The Intrinsic Value Of CMS Energy Corporation (NYSE:CMS)
Key Insights
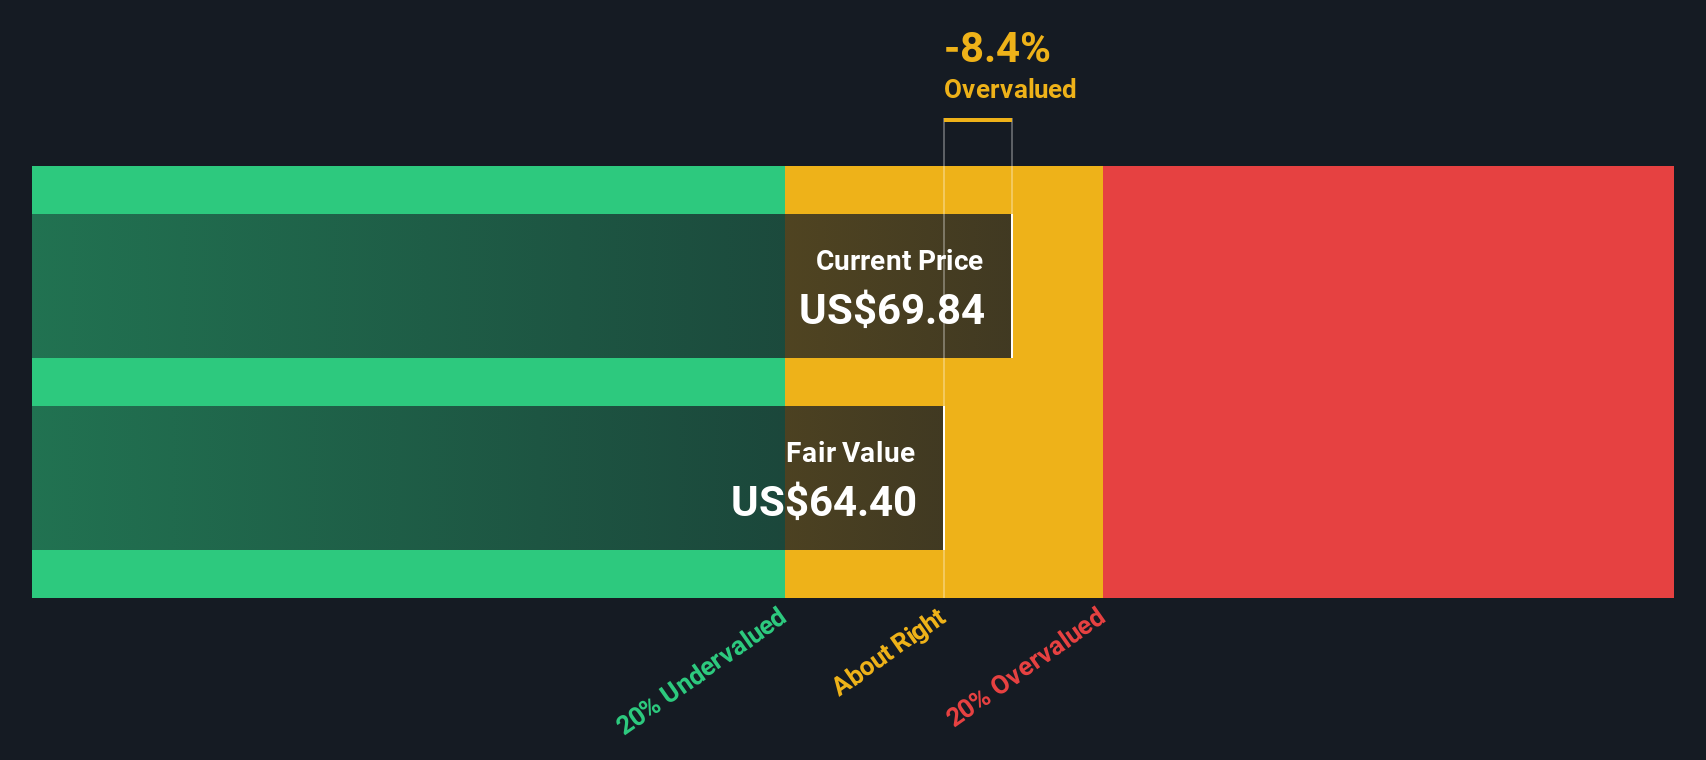
- The projected fair value for CMS Energy is US$64.40 based on Dividend Discount Model
- With US$69.84 share price, CMS Energy appears to be trading close to its estimated fair value
- Our fair value estimate is 18% lower than CMS Energy's analyst price target of US$78.23
Today we'll do a simple run through of a valuation method used to estimate the attractiveness of CMS Energy Corporation (NYSE:CMS) as an investment opportunity by taking the expected future cash flows and discounting them to their present value. We will take advantage of the Discounted Cash Flow (DCF) model for this purpose. Before you think you won't be able to understand it, just read on! It's actually much less complex than you'd imagine.
We would caution that there are many ways of valuing a company and, like the DCF, each technique has advantages and disadvantages in certain scenarios. Anyone interested in learning a bit more about intrinsic value should have a read of the Simply Wall St analysis model.
Is CMS Energy Fairly Valued?
We have to calculate the value of CMS Energy slightly differently to other stocks because it is a integrated utilities company. In this approach dividends per share (DPS) are used, as free cash flow is difficult to estimate and often not reported by analysts. This often underestimates the value of a stock, but it can still be good as a comparison to competitors. We use the Gordon Growth Model, which assumes dividend will grow into perpetuity at a rate that can be sustained. For a number of reasons a very conservative growth rate is used that cannot exceed that of a company's Gross Domestic Product (GDP). In this case we used the 5-year average of the 10-year government bond yield (3.3%). The expected dividend per share is then discounted to today's value at a cost of equity of 7.0%. Compared to the current share price of US$69.8, the company appears around fair value at the time of writing. Valuations are imprecise instruments though, rather like a telescope - move a few degrees and end up in a different galaxy. Do keep this in mind.
Value Per Share = Expected Dividend Per Share / (Discount Rate - Perpetual Growth Rate)
= US$2.4 / (7.0% – 3.3%)
= US$64.4
The Assumptions
We would point out that the most important inputs to a discounted cash flow are the discount rate and of course the actual cash flows. You don't have to agree with these inputs, I recommend redoing the calculations yourself and playing with them. The DCF also does not consider the possible cyclicality of an industry, or a company's future capital requirements, so it does not give a full picture of a company's potential performance. Given that we are looking at CMS Energy as potential shareholders, the cost of equity is used as the discount rate, rather than the cost of capital (or weighted average cost of capital, WACC) which accounts for debt. In this calculation we've used 7.0%, which is based on a levered beta of 0.800. Beta is a measure of a stock's volatility, compared to the market as a whole. We get our beta from the industry average beta of globally comparable companies, with an imposed limit between 0.8 and 2.0, which is a reasonable range for a stable business.
Check out our latest analysis for CMS Energy
SWOT Analysis for CMS Energy
- No major strengths identified for CMS.
- Earnings declined over the past year.
- Interest payments on debt are not well covered.
- Dividend is low compared to the top 25% of dividend payers in the Integrated Utilities market.
- Annual earnings are forecast to grow for the next 3 years.
- Good value based on P/E ratio compared to estimated Fair P/E ratio.
- Debt is not well covered by operating cash flow.
- Paying a dividend but company has no free cash flows.
- Annual earnings are forecast to grow slower than the American market.
Moving On:
Whilst important, the DCF calculation ideally won't be the sole piece of analysis you scrutinize for a company. It's not possible to obtain a foolproof valuation with a DCF model. Instead the best use for a DCF model is to test certain assumptions and theories to see if they would lead to the company being undervalued or overvalued. If a company grows at a different rate, or if its cost of equity or risk free rate changes sharply, the output can look very different. For CMS Energy, there are three additional aspects you should look at:
- Risks: Be aware that CMS Energy is showing 2 warning signs in our investment analysis , and 1 of those is potentially serious...
- Management:Have insiders been ramping up their shares to take advantage of the market's sentiment for CMS's future outlook? Check out our management and board analysis with insights on CEO compensation and governance factors.
- Other High Quality Alternatives: Do you like a good all-rounder? Explore our interactive list of high quality stocks to get an idea of what else is out there you may be missing!
PS. Simply Wall St updates its DCF calculation for every American stock every day, so if you want to find the intrinsic value of any other stock just search here.
Have feedback on this article? Concerned about the content? Get in touch with us directly. Alternatively, email editorial-team (at) simplywallst.com.
This article by Simply Wall St is general in nature. We provide commentary based on historical data and analyst forecasts only using an unbiased methodology and our articles are not intended to be financial advice. It does not constitute a recommendation to buy or sell any stock, and does not take account of your objectives, or your financial situation. We aim to bring you long-term focused analysis driven by fundamental data. Note that our analysis may not factor in the latest price-sensitive company announcements or qualitative material. Simply Wall St has no position in any stocks mentioned.