
 Nasdaq
 华尔街日报
华尔街日报Does AstraZeneca Still Offer Value After Its 28% 2025 Surge and Strong Pipeline Progress?
- If you have been wondering whether AstraZeneca is still worth buying after its big run, you are not alone. This article is all about unpacking what that price actually implies.
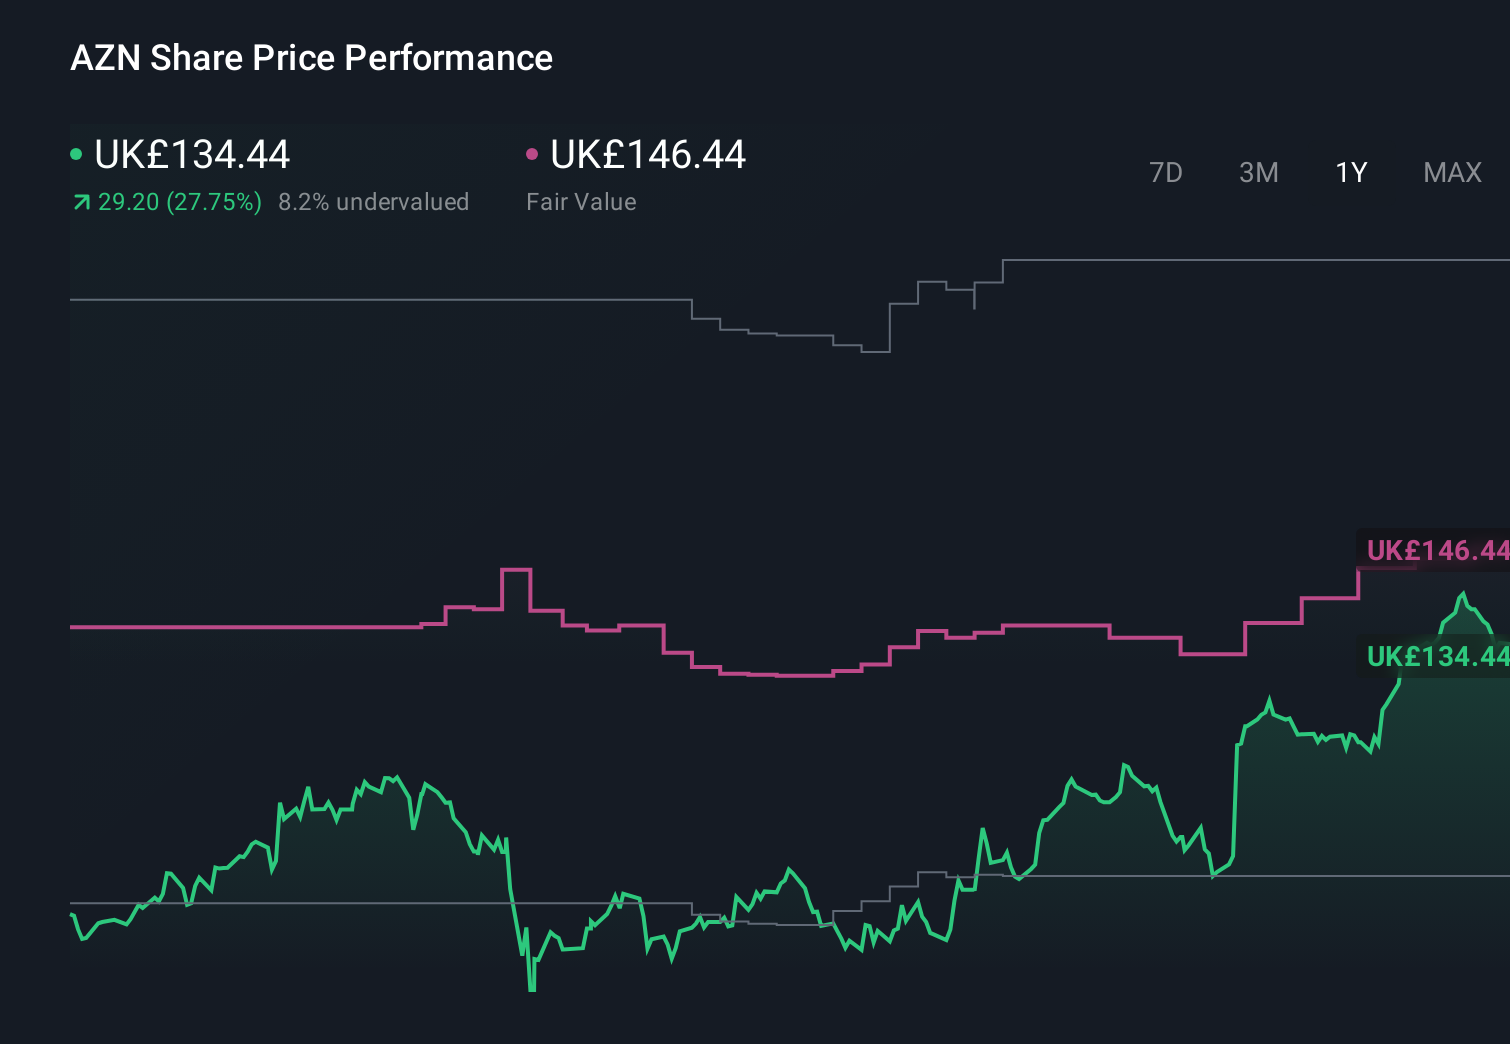
- The stock is up 0.6% over the last week, 1.0% over the last month, and 27.9% year to date, adding to a 31.4% 1 year gain and more than doubling over 5 years with a 102.2% return.
- Those moves have been underpinned by a steady stream of pipeline and regulatory updates, together with ongoing progress in its core oncology and rare disease franchises. This combination has helped investors reassess both AstraZeneca's long term growth runway and the risk profile attached to its drug portfolio.
- Even after that rally, AstraZeneca only scores a 3/6 valuation check score. In this article, we will walk through what traditional valuation methods say about the stock, and then finish with a more nuanced way of thinking about what it is really worth.
Approach 1: AstraZeneca Discounted Cash Flow (DCF) Analysis
A Discounted Cash Flow model takes a company’s expected future cash flows and discounts them back into today’s dollars to estimate what the business is worth now. For AstraZeneca, the model uses a 2 Stage Free Cash Flow to Equity approach based on cash flow projections.
The company generated last twelve months free cash flow of about $10.2 billion, with analysts expecting this to grow steadily over the rest of the decade. Simply Wall St aggregates analyst estimates out to 2029, where free cash flow is projected to reach roughly $19.1 billion, and then extrapolates further modest growth into the 2030s using its own assumptions.
Rolling all of these projected cash flows into the model produces an estimated intrinsic value of $236.29 per share. Compared with the current market price, this implies AstraZeneca is trading at about a 42.5% discount to its DCF value.
Result: UNDERVALUED
Our Discounted Cash Flow (DCF) analysis suggests AstraZeneca is undervalued by 42.5%. Track this in your watchlist or portfolio, or discover 905 more undervalued stocks based on cash flows.

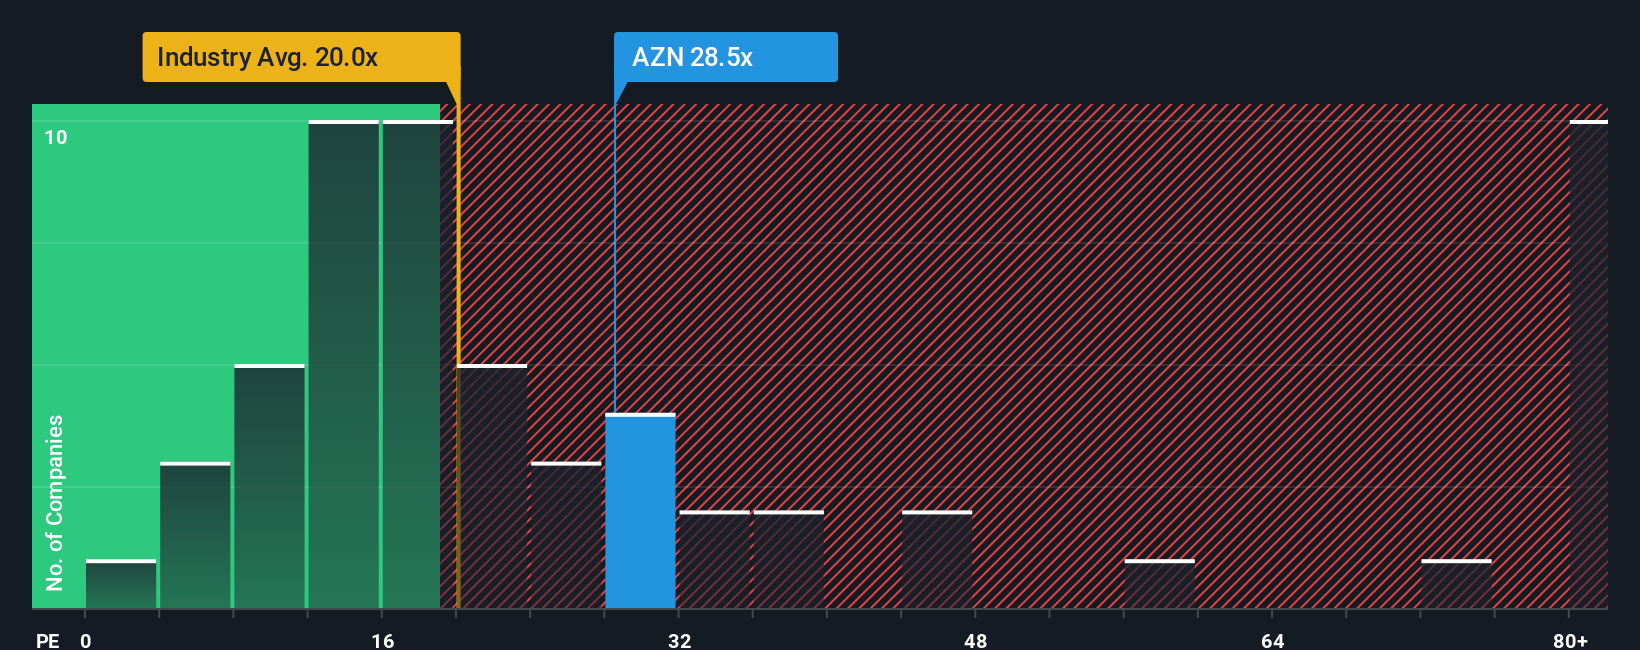
Approach 2: AstraZeneca Price vs Earnings
For profitable companies like AstraZeneca, the price to earnings ratio is a useful way to judge whether investors are paying a reasonable price for each unit of current earnings. In general, faster growth and lower perceived risk justify a higher, or more expensive, PE multiple, while slower growth or higher uncertainty should result in a lower, cheaper PE.
AstraZeneca currently trades on about 30.1x earnings, which is higher than both the Pharmaceuticals industry average of 22.5x and the broader peer group average of 12.9x. At first glance, that premium suggests the market is already paying up for AstraZeneca’s growth prospects and quality.
Simply Wall St’s Fair Ratio framework goes a step further by estimating what PE multiple a company should trade on, given its growth outlook, profitability, industry, market cap and risk profile. For AstraZeneca, this Fair Ratio is 31.2x, slightly above the current 30.1x multiple. Because this approach adjusts for fundamentals rather than relying on blunt peer comparisons, it provides a more tailored view of value. On that basis, AstraZeneca appears modestly undervalued relative to what its earnings profile warrants.
Result: UNDERVALUED
PE ratios tell one story, but what if the real opportunity lies elsewhere? Discover 1445 companies where insiders are betting big on explosive growth.
Upgrade Your Decision Making: Choose your AstraZeneca Narrative
Earlier we mentioned that there is an even better way to understand valuation, so let us introduce you to Narratives, a simple framework on Simply Wall St’s Community page that lets you tell the story behind your numbers by linking your view of AstraZeneca’s pipeline, growth, margins and risks to a concrete forecast, a fair value, and a clear decision based on how that fair value compares to today’s price. This framework then updates dynamically as new news or earnings arrive. For example, one investor might build a bullish AstraZeneca Narrative around oncology execution, margin expansion to about 22 percent, and a fair value near £146 per share. Another, more cautious investor could focus on patent expiries, pricing pressure and downside risk, attach a lower revenue growth path, narrower margins and a fair value closer to £108. Both of those perspectives can coexist side by side, giving you an accessible way to choose, adapt, and refine the story that best matches your own assumptions and risk tolerance.
Do you think there's more to the story for AstraZeneca? Head over to our Community to see what others are saying!
This article by Simply Wall St is general in nature. We provide commentary based on historical data and analyst forecasts only using an unbiased methodology and our articles are not intended to be financial advice. It does not constitute a recommendation to buy or sell any stock, and does not take account of your objectives, or your financial situation. We aim to bring you long-term focused analysis driven by fundamental data. Note that our analysis may not factor in the latest price-sensitive company announcements or qualitative material. Simply Wall St has no position in any stocks mentioned.
Have feedback on this article? Concerned about the content? Get in touch with us directly. Alternatively, email editorial-team@simplywallst.com