
 Nasdaq
 华尔街日报
华尔街日报Is CNH Industrial a Value Opportunity After its 2025 Share Price Slump?
- If you are wondering whether CNH Industrial is quietly turning into a value opportunity, or if the lower share price is a warning sign, this article will walk you through what the numbers are really saying.
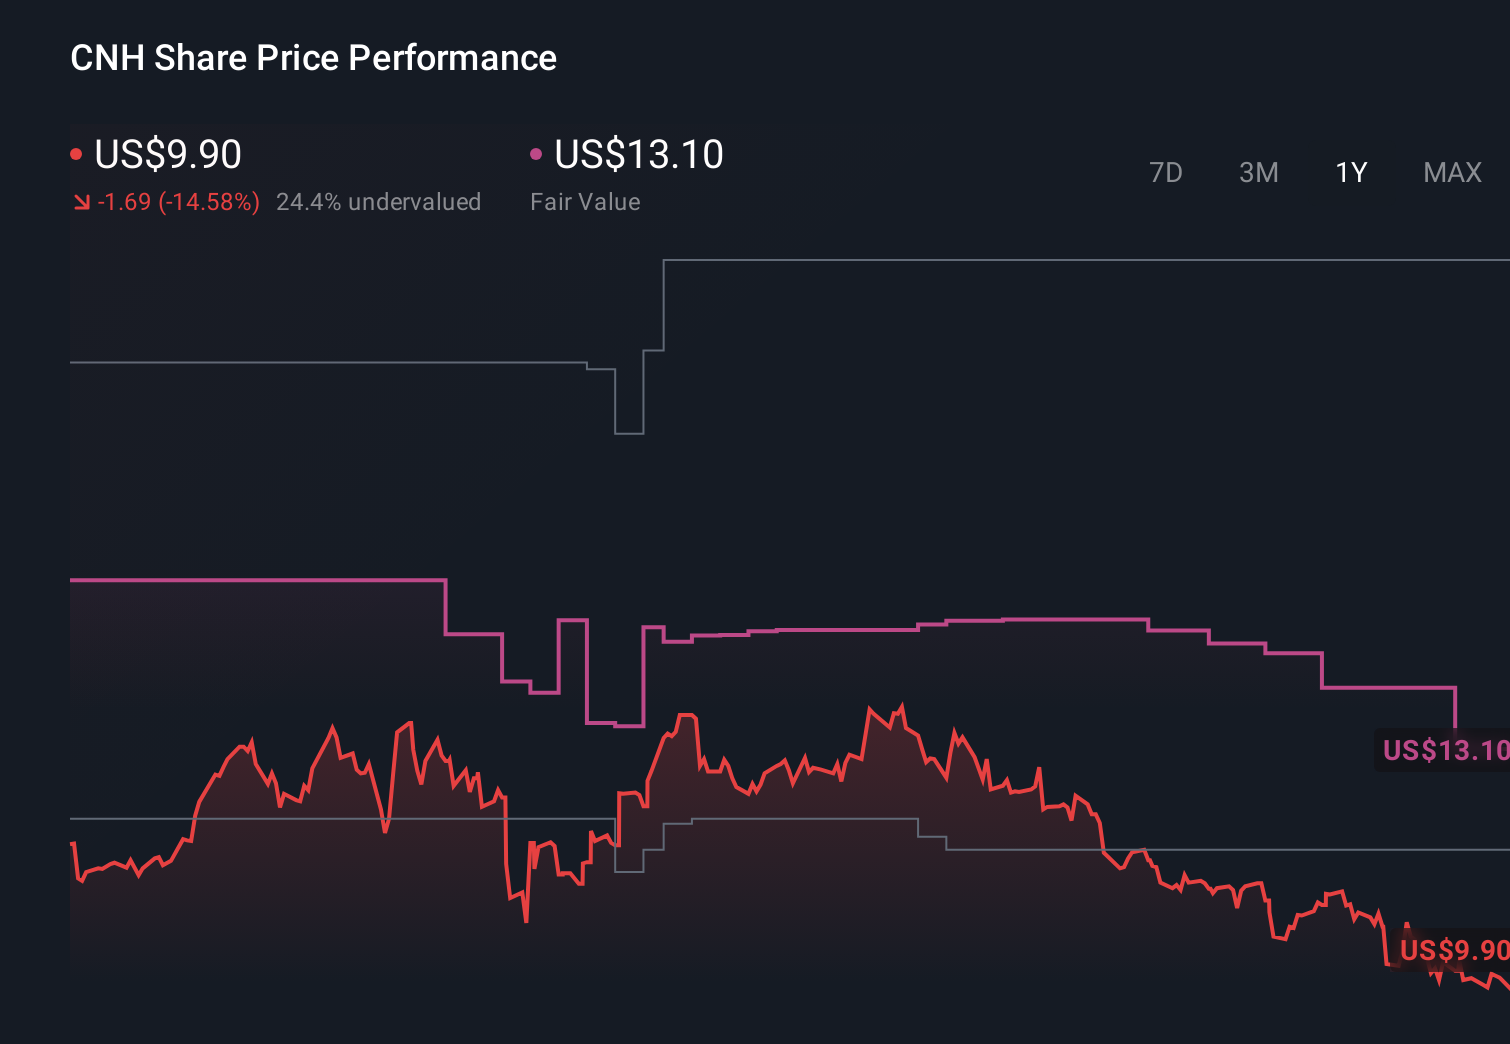
- The stock has bounced 3.4% over the last week and 2.0% over the past month, but it is still down 11.5% year to date and 16.8% over the last year, which is exactly the kind of setup value investors like to investigate.
- Recently, the market has been reacting to shifting expectations around global equipment demand, capital allocation priorities and the company’s ongoing efficiency efforts, all of which feed into how investors are thinking about CNH Industrial’s future cash flows. At the same time, broader sentiment toward capital goods names has been choppy. This can exaggerate moves in a stock that already divides opinion.
- On our checks, CNH Industrial currently scores a 4/6 valuation score, suggesting it screens as undervalued on most, but not all, of the metrics we track. Next, we will compare different valuation approaches and then finish with a more holistic way to think about what the stock is really worth.
Find out why CNH Industrial's -16.8% return over the last year is lagging behind its peers.
Approach 1: CNH Industrial Discounted Cash Flow (DCF) Analysis
A Discounted Cash Flow, or DCF, model estimates what a business is worth by projecting its future cash flows and then discounting them back to today’s value. For CNH Industrial, this approach uses a 2 Stage Free Cash Flow to Equity framework built on cash flow projections and a longer term extrapolation.
CNH Industrial generated trailing twelve month free cash flow of about $2.3 billion, and analysts expect this to step down in the near term before rebuilding, with projected free cash flow of roughly $2.1 billion by 2029. Beyond the explicit analyst horizon, Simply Wall St extrapolates these figures out to 2035, assuming more moderate growth as the business matures.
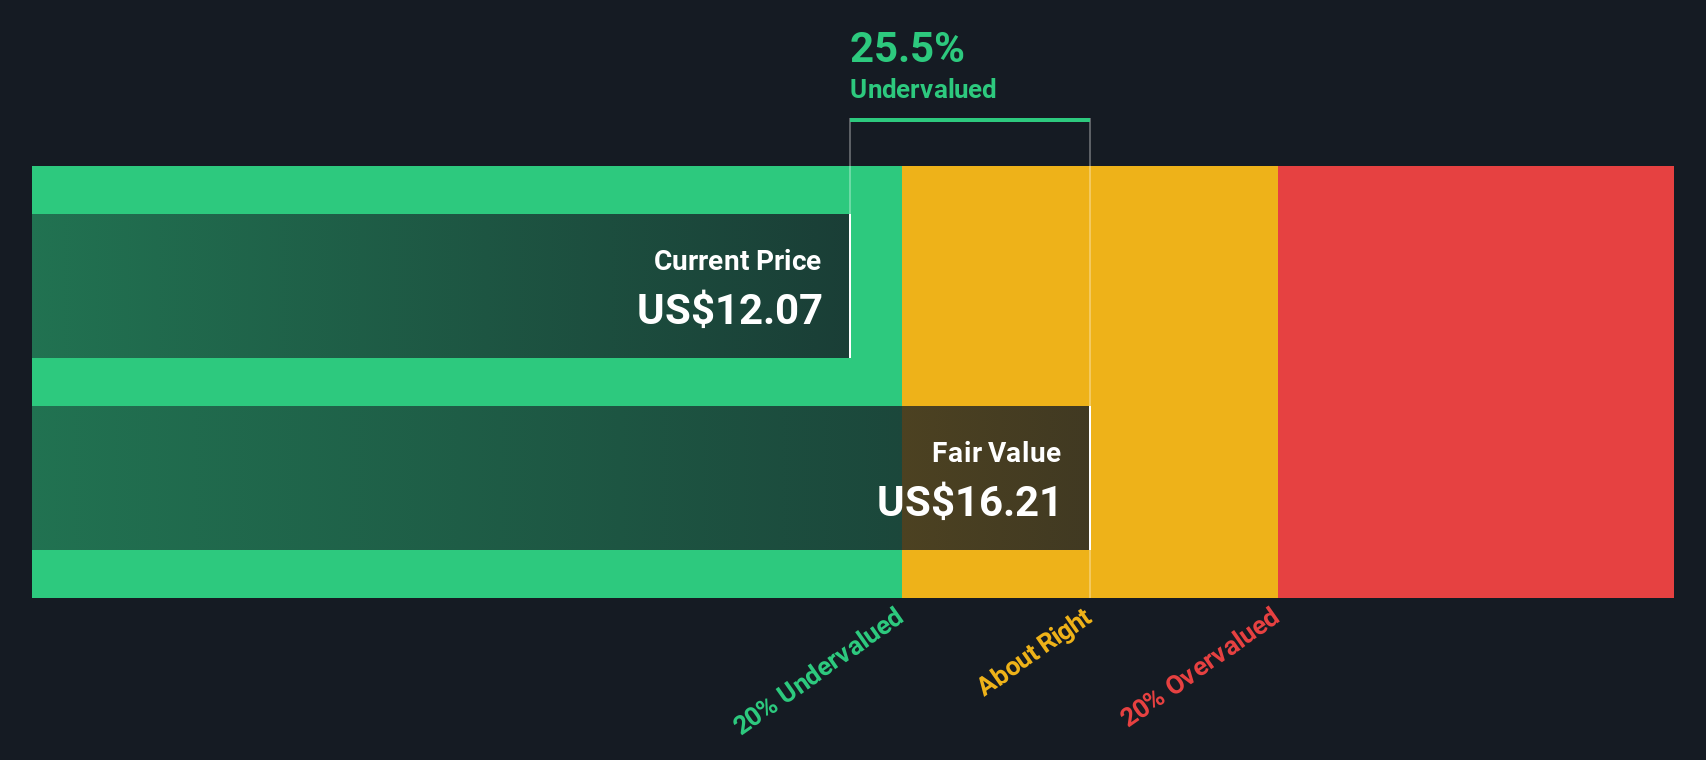
Pulling all of those projected cash flows back into today’s dollars produces an estimated intrinsic value of about $16.40 per share. Compared with the current market price, that indicates the stock is trading at roughly a 40.1% discount, which implies investors are paying materially less than what the cash flows indicate the business is worth.
Result: UNDERVALUED
Our Discounted Cash Flow (DCF) analysis suggests CNH Industrial is undervalued by 40.1%. Track this in your watchlist or portfolio, or discover 909 more undervalued stocks based on cash flows.
Approach 2: CNH Industrial Price vs Earnings
For companies that are consistently profitable, the price to earnings ratio is often the go to yardstick because it links what investors pay directly to the earnings the business is generating today. What counts as a normal or fair PE depends on how quickly profits are expected to grow and how risky or cyclical those earnings are, with higher growth and lower risk usually justifying a higher multiple.
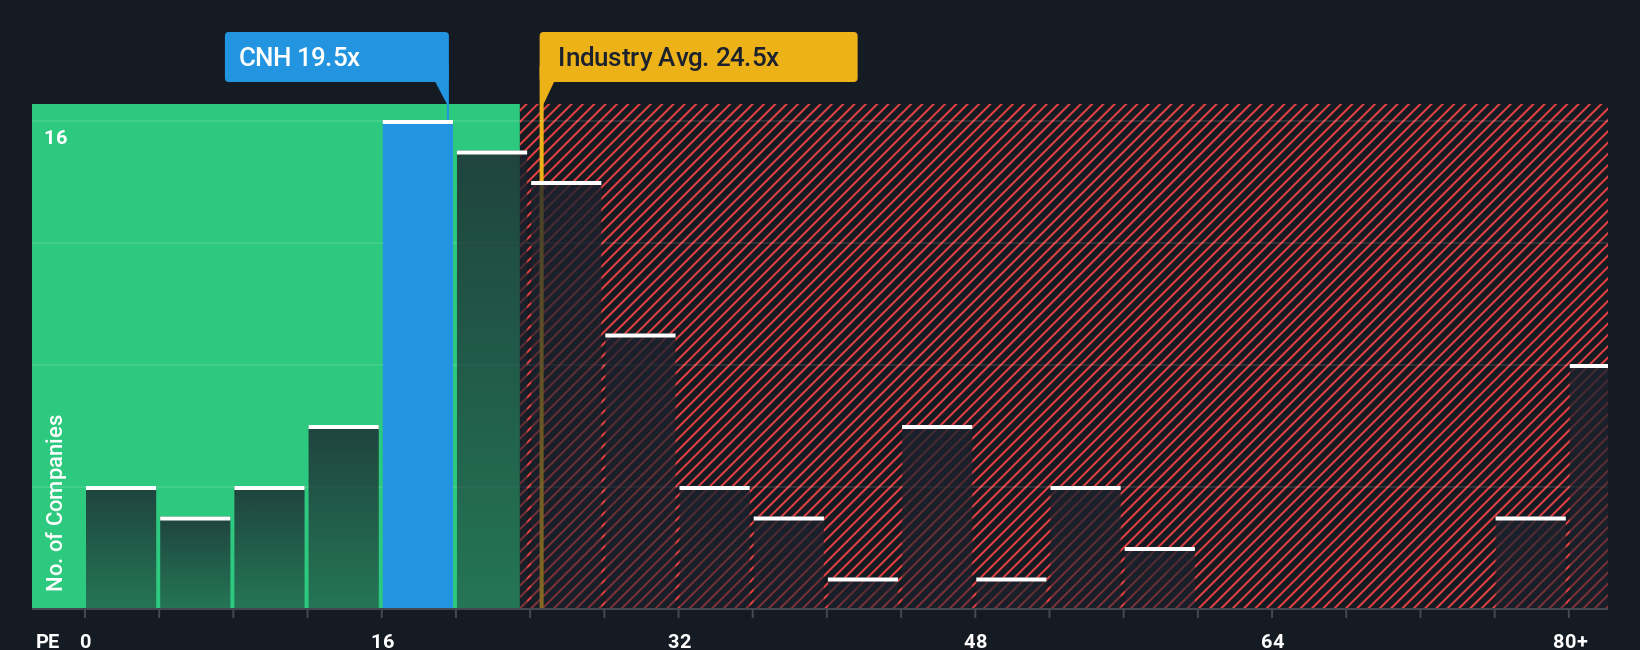
CNH Industrial currently trades on a PE of about 20.5x, which is slightly above the peer average of roughly 19.5x, but below the broader Machinery industry average of around 25.7x. Simply Wall St also calculates a Fair Ratio of 36.5x for CNH Industrial, a proprietary estimate of the PE you would expect given its earnings growth outlook, margins, industry, market cap and risk profile. This Fair Ratio goes a step beyond simple peer or sector comparisons because it adjusts for the company’s own fundamentals rather than assuming that all Machinery stocks deserve the same multiple. On that basis, CNH Industrial’s current PE looks materially lower than its 36.5x Fair Ratio, which suggests the shares may be undervalued from an earnings multiple perspective.
Result: UNDERVALUED
PE ratios tell one story, but what if the real opportunity lies elsewhere? Discover 1446 companies where insiders are betting big on explosive growth.
Upgrade Your Decision Making: Choose your CNH Industrial Narrative
Earlier we mentioned that there is an even better way to understand valuation, so let us introduce you to Narratives, a simple way to connect your view of CNH Industrial’s business to a concrete forecast and a fair value that you can compare with today’s price.
A Narrative on Simply Wall St is your story behind the numbers, where you spell out how you think CNH Industrial’s revenue, margins and earnings will evolve, and the platform turns that perspective into a financial forecast and an implied fair value.
These Narratives live on the Community page used by millions of investors. They are dynamic, automatically refreshing when new information like earnings updates, tariff news or product announcements changes the outlook.
That makes them a practical decision-making tool, because you can quickly see whether your Narrative fair value still sits above the current share price, or has dropped below it.
For example, one CNH Industrial Narrative might lean toward the upper end of analyst expectations with stronger revenue growth and a fair value closer to 21 dollars. A more conservative Narrative might assume slower adoption of new technologies, more persistent tariff pressure and a fair value nearer 11.5 dollars. By comparing where the actual price sits between those two viewpoints you can decide which story you believe and act accordingly.
Do you think there's more to the story for CNH Industrial? Head over to our Community to see what others are saying!
This article by Simply Wall St is general in nature. We provide commentary based on historical data and analyst forecasts only using an unbiased methodology and our articles are not intended to be financial advice. It does not constitute a recommendation to buy or sell any stock, and does not take account of your objectives, or your financial situation. We aim to bring you long-term focused analysis driven by fundamental data. Note that our analysis may not factor in the latest price-sensitive company announcements or qualitative material. Simply Wall St has no position in any stocks mentioned.
Have feedback on this article? Concerned about the content? Get in touch with us directly. Alternatively, email editorial-team@simplywallst.com