
 Nasdaq
 华尔街日报
华尔街日报Is Hapag-Lloyd Attractively Priced After 2025 Shipping Slowdown And Red Sea Disruptions?
- Wondering if Hapag-Lloyd at around €122.90 is a bargain or a value trap right now? This article will walk you through what the current price is really telling us.
- The stock has bounced 6.6% over the last week and 4.8% over the past month, but is still down 24.3% year to date and 15.7% over the last year, which hints at shifting sentiment and possibly changing risk perceptions.
- Recent headlines have focused on container shipping demand normalising after the post pandemic surge. At the same time, persistent supply chain rerouting through regions like the Red Sea and Suez has kept freight rates more volatile than usual. Industry chatter about capacity additions and long term contract negotiations is also shaping expectations for Hapag-Lloyd's future cash flows and profitability.
- On our framework Hapag-Lloyd scores just 1/6 on valuation checks, suggesting it only screens as undervalued on one of six metrics. We will unpack what different valuation approaches say, and then finish with a more nuanced way to think about the stock's true worth.
Hapag-Lloyd scores just 1/6 on our valuation checks. See what other red flags we found in the full valuation breakdown.
Approach 1: Hapag-Lloyd Discounted Cash Flow (DCF) Analysis
A Discounted Cash Flow model estimates what a company is worth by projecting the cash it can generate in the future and then discounting those cash flows back into today’s euros.
For Hapag-Lloyd, the latest twelve month Free Cash Flow (FCF) is about €2.0 billion. Analysts provide detailed forecasts for the next few years, with FCF expected to be around €1.4 billion by 2027. Simply Wall St then extrapolates cash flows further out to 2035 using gradually moderating declines. These long term projections are combined in a 2 Stage Free Cash Flow to Equity model.
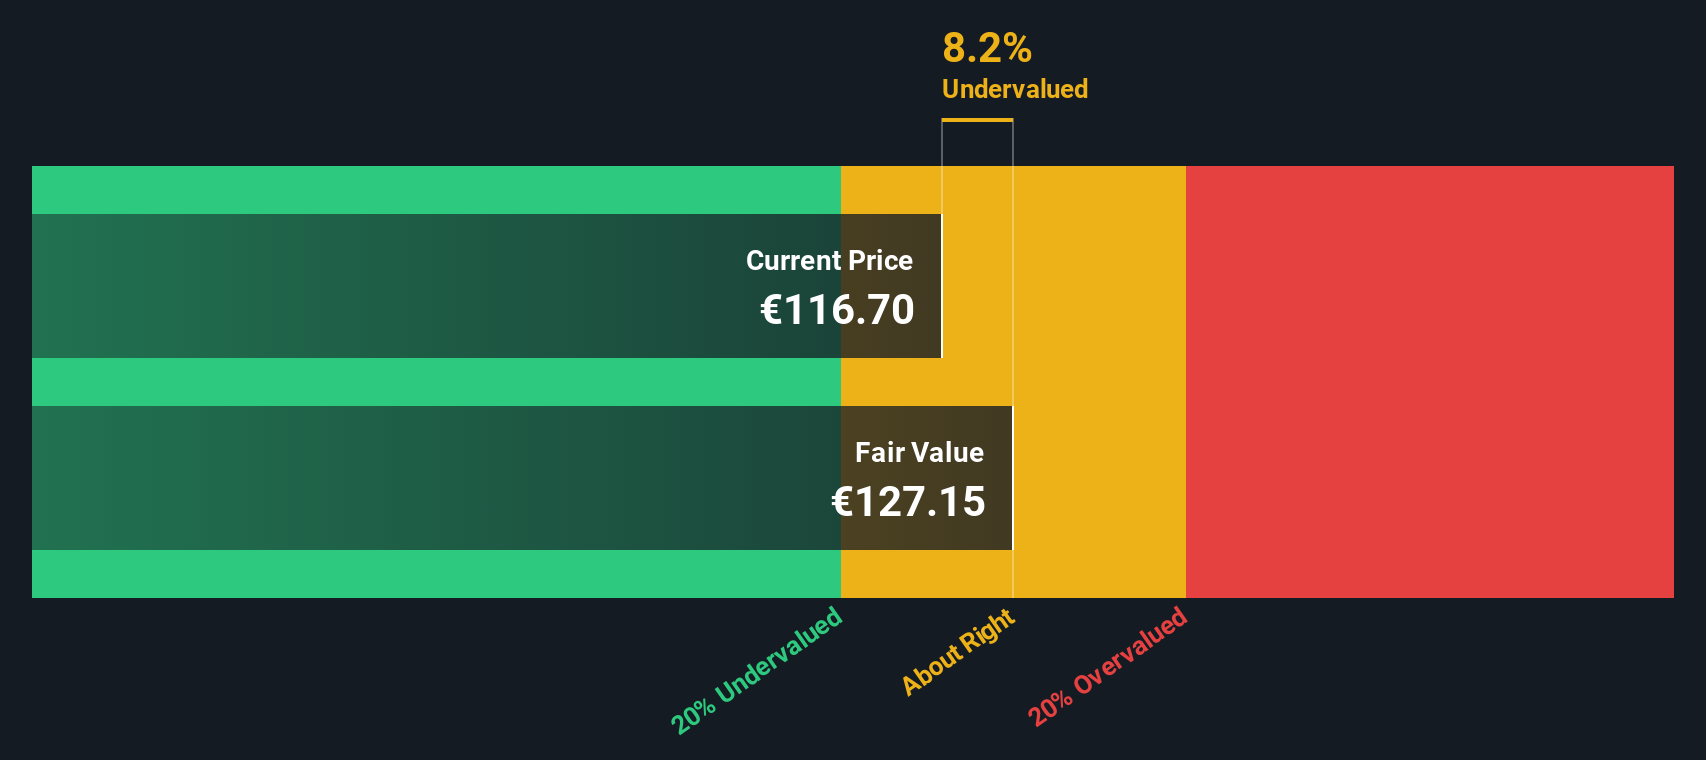
On this basis, the model arrives at an intrinsic value of roughly €138.12 per share. Compared with the recent share price of around €122.90, the DCF suggests the stock is about 11.0% undervalued, which points to a modest margin of safety if the cash flow assumptions hold.
Result: UNDERVALUED
Our Discounted Cash Flow (DCF) analysis suggests Hapag-Lloyd is undervalued by 11.0%. Track this in your watchlist or portfolio, or discover 907 more undervalued stocks based on cash flows.
Approach 2: Hapag-Lloyd Price vs Earnings
For profitable companies like Hapag-Lloyd, the price to earnings, or PE, ratio is a straightforward way to gauge how much investors are willing to pay for each euro of current earnings. It captures the market’s view on both the durability of profits and the outlook for future growth.
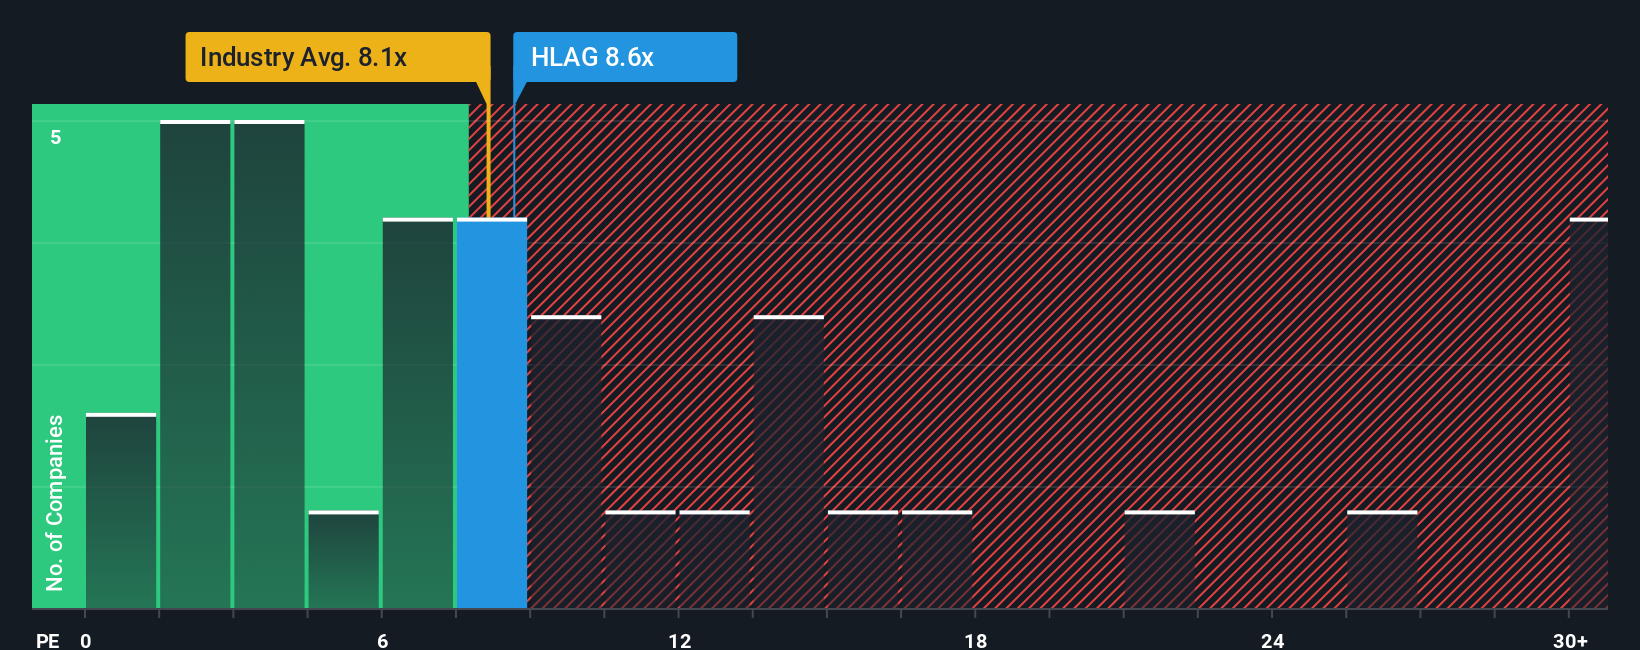
In general, stronger growth and lower perceived risk justify a higher PE, while cyclical or riskier earnings usually command a discount. Hapag-Lloyd currently trades on a PE of about 14.0x, which is above the broader Shipping industry average of roughly 9.9x and also higher than the peer group average of around 11.5x. On those simple comparisons alone, the stock can look a little expensive.
Simply Wall St’s Fair Ratio, at about 12.3x, offers a more tailored benchmark by factoring in Hapag-Lloyd’s specific earnings growth profile, profitability, risk characteristics, industry positioning and market cap. This makes it more informative than a blunt comparison with peers or industry averages. Versus this Fair Ratio, the current 14.0x multiple suggests the market is paying a premium to what the fundamentals would typically warrant, implying some overvaluation on a multiples basis.
Result: OVERVALUED
PE ratios tell one story, but what if the real opportunity lies elsewhere? Discover 1446 companies where insiders are betting big on explosive growth.
Upgrade Your Decision Making: Choose your Hapag-Lloyd Narrative
Earlier we mentioned that there is an even better way to understand valuation, so let us introduce you to Narratives, which are simply your story about a company, translated into numbers like future revenue, earnings, margins and a fair value estimate. A Narrative connects three things: what you believe about Hapag-Lloyd’s business, what that means for its financial forecast, and what that implies as a fair value per share. On Simply Wall St, Narratives are an easy tool used by millions of investors within the Community page, where you can quickly adjust assumptions and instantly see how your fair value compares to the current share price to help inform your decisions. Because Narratives update dynamically when new information such as earnings, news, or analyst revisions arrives, your view of fair value stays current rather than static. For example, one investor might build a cautious Narrative around normalising freight rates and arrive at a fair value near the lower analyst target of €72. Another investor who focuses on terminal expansion, digital upgrades and efficiency gains might justify a fair value closer to the upper target of €140. Narratives make those differences transparent and comparable in one place.
Do you think there's more to the story for Hapag-Lloyd? Head over to our Community to see what others are saying!

This article by Simply Wall St is general in nature. We provide commentary based on historical data and analyst forecasts only using an unbiased methodology and our articles are not intended to be financial advice. It does not constitute a recommendation to buy or sell any stock, and does not take account of your objectives, or your financial situation. We aim to bring you long-term focused analysis driven by fundamental data. Note that our analysis may not factor in the latest price-sensitive company announcements or qualitative material. Simply Wall St has no position in any stocks mentioned.
Have feedback on this article? Concerned about the content? Get in touch with us directly. Alternatively, email editorial-team@simplywallst.com