
 Nasdaq
 华尔街日报
华尔街日报Renault Valuation After 23.5% Slide in 2025 and EV Strategy Shifts
- If you have been wondering whether Renault at €36.01 is a bargain or a value trap, you are not alone, and this breakdown is designed to give you a clear, valuation focused answer.
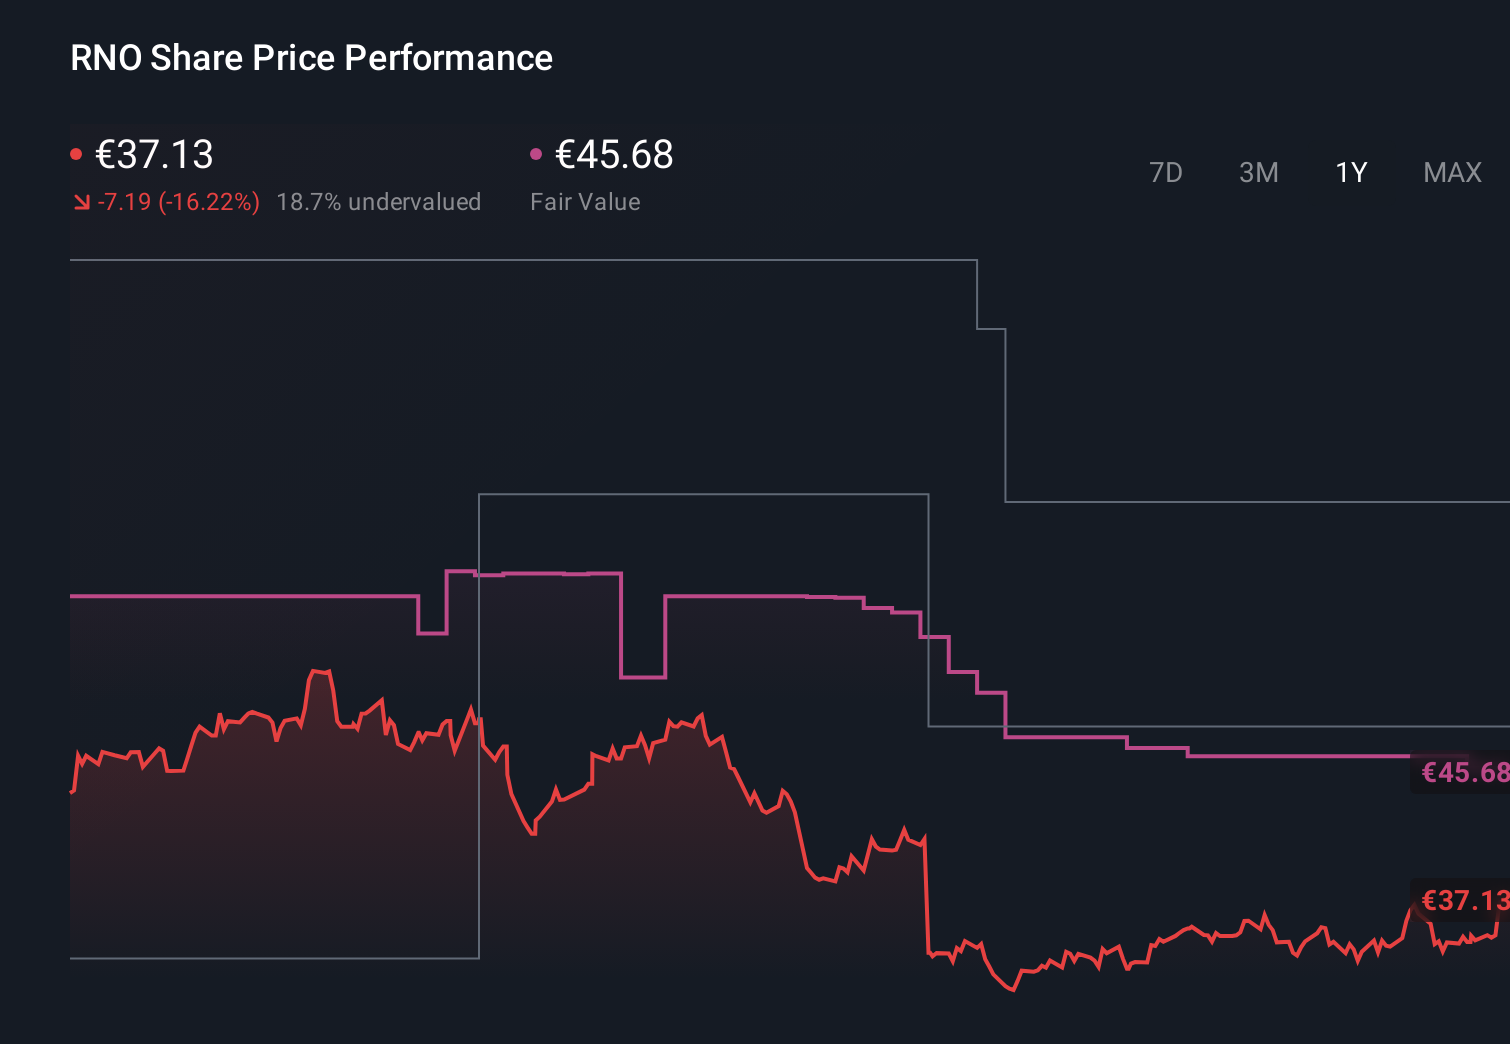
- The stock has climbed 3.5% over the last week and 4.0% over the past month, but it is still down 23.5% year to date and 14.3% over the last year, which hints that sentiment and risk perception may still be in flux despite a 17.0% gain over three years and 7.8% over five years.
- Recent headlines around Renault have focused on its strategic partnerships in electric and hybrid vehicles as well as ongoing portfolio reshaping in key markets, which help explain some of the volatility in the share price. At the same time, investors are watching how these moves reposition Renault within the intensely competitive European auto landscape, particularly as the industry pushes deeper into electrification and software focused platforms.
- Right now, Renault scores a solid 5 out of 6 on our valuation checks. This suggests it screens as undervalued on most of the metrics we use. Next we will walk through those different valuation approaches before circling back to an even better way of thinking about what the stock is really worth.
Find out why Renault's -14.3% return over the last year is lagging behind its peers.
Approach 1: Renault Discounted Cash Flow (DCF) Analysis
The Discounted Cash Flow, or DCF, model estimates what a company is worth by projecting the cash it can generate in the future and then discounting those amounts back into today’s euros.
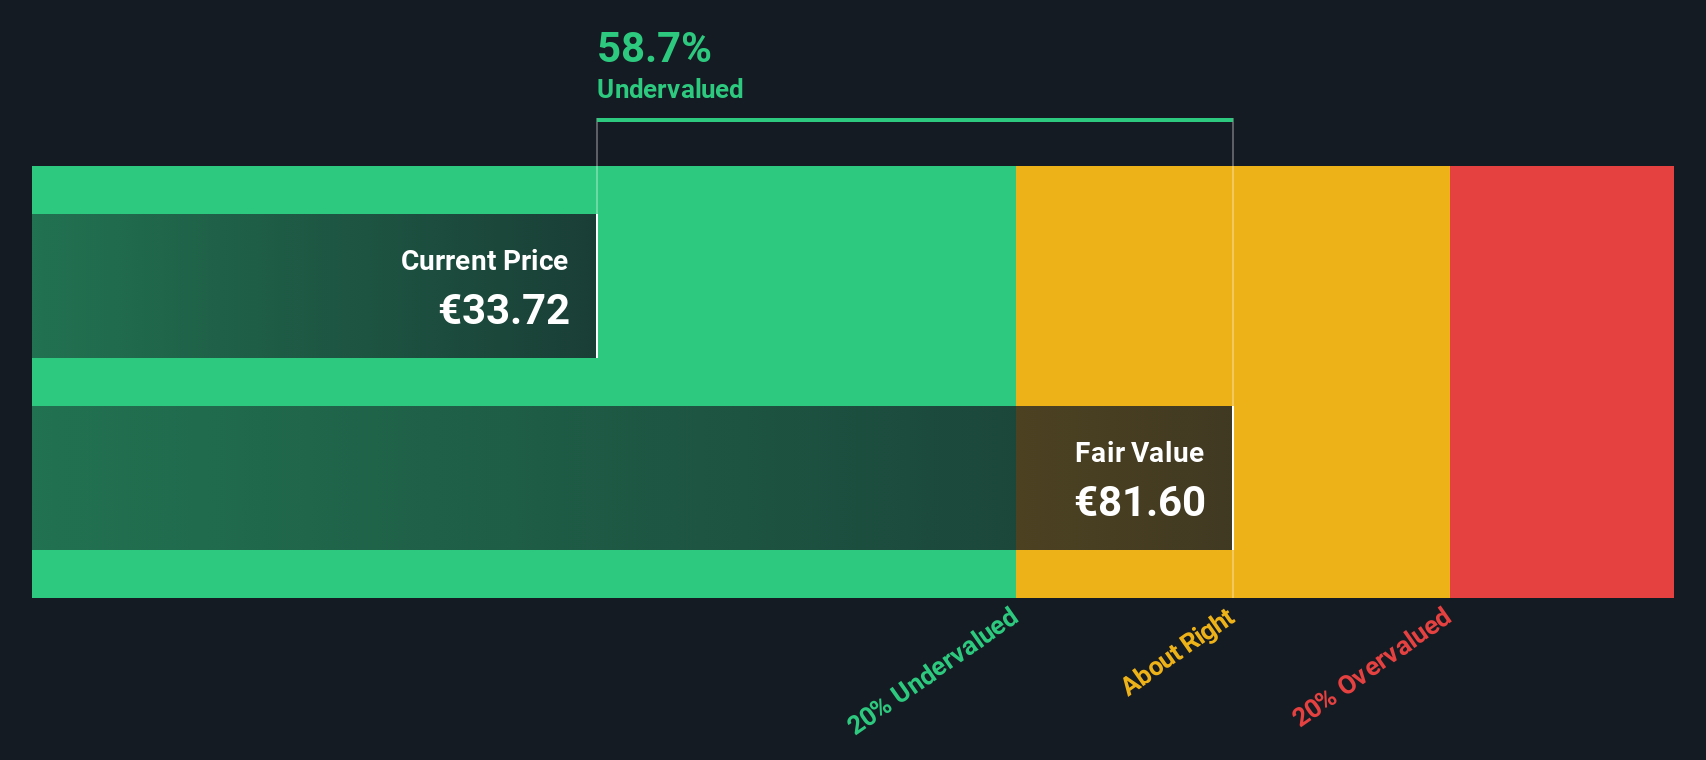
For Renault, the latest twelve month Free Cash Flow is about €0.84 billion, and analysts expect this to rise meaningfully over time as the business scales its electric and software focused strategy. Simply Wall St uses analyst forecasts for the next few years, then extrapolates those trends further out, resulting in projected Free Cash Flow of roughly €2.95 billion in 2035. All of these future cash flows are then discounted back using a required rate of return, producing an estimated intrinsic value of around €81.60 per share.
Set against the current share price of roughly €36, the DCF implies Renault is trading at about a 55.9% discount to its calculated fair value, which suggests that the market may be overly cautious about its long term prospects.
Result: UNDERVALUED
Our Discounted Cash Flow (DCF) analysis suggests Renault is undervalued by 55.9%. Track this in your watchlist or portfolio, or discover 908 more undervalued stocks based on cash flows.
Approach 2: Renault Price vs Sales
For many established automakers, the Price to Sales ratio is a practical way to gauge valuation because revenue is typically more stable than earnings, which can swing with one off charges, restructuring, or investment cycles.
In general, higher growth and lower perceived risk justify a higher multiple, while slower growth or more cyclical earnings argue for a lower, more conservative level. That is why it is useful to look at where Renault trades relative to both its industry and its own fundamentals.
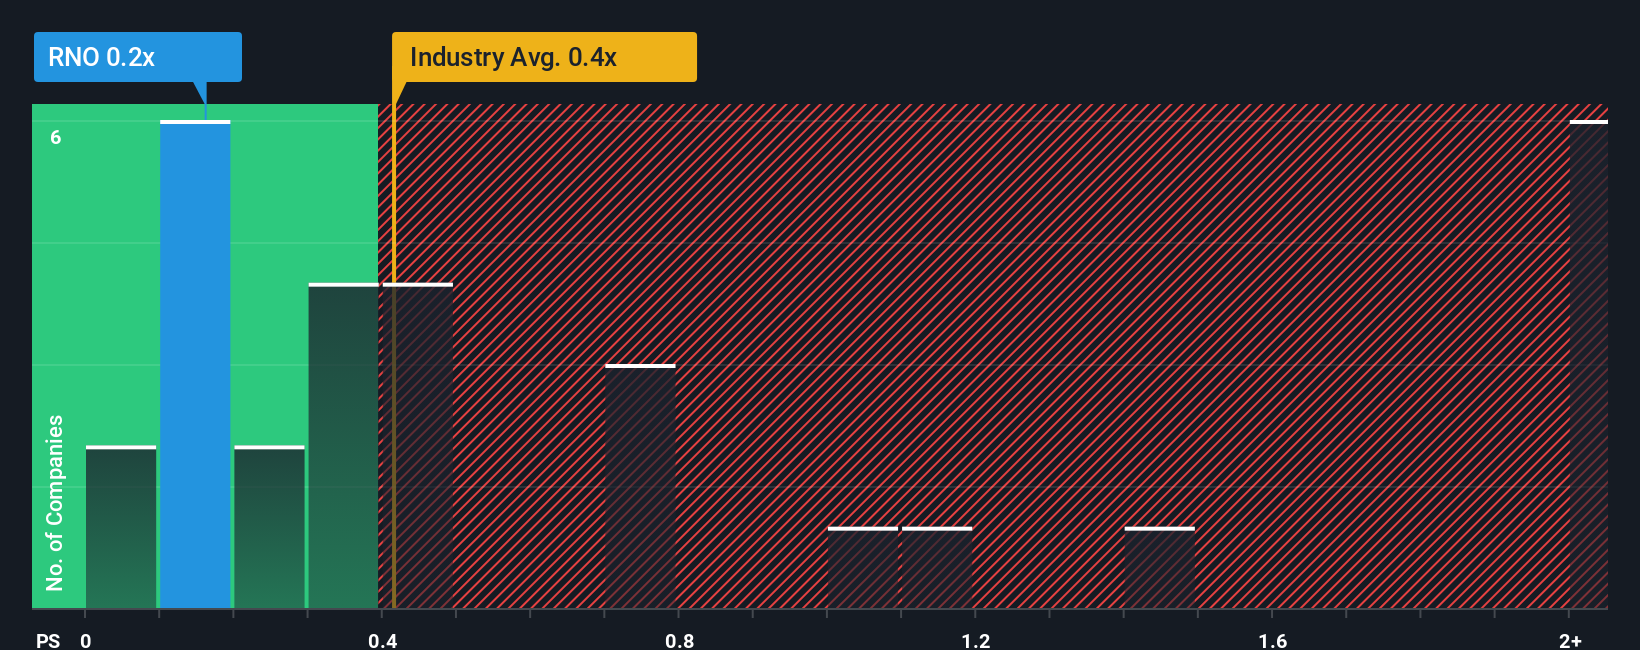
Renault currently trades on a Price to Sales ratio of about 0.17x, which is well below the Auto industry average of roughly 0.82x and also below the peer group average of around 0.46x. Simply Wall St’s proprietary Fair Ratio for Renault is 0.23x. This is the Price to Sales multiple that might be expected given its growth outlook, profit margins, risk profile, industry, and market cap.
This Fair Ratio framework is more informative than a simple peer or industry comparison because it adjusts for Renault specific characteristics rather than assuming all automakers deserve the same valuation. With the actual 0.17x multiple sitting noticeably below the 0.23x Fair Ratio, the stock still screens as undervalued on this measure.
Result: UNDERVALUED
PS ratios tell one story, but what if the real opportunity lies elsewhere? Discover 1446 companies where insiders are betting big on explosive growth.
Upgrade Your Decision Making: Choose your Renault Narrative
Earlier we mentioned that there is an even better way to understand valuation. Let us introduce you to Narratives, which are simply your story about Renault, translated into assumptions for its future revenue, earnings, margins and fair value. These are then linked to a dynamic forecast on Simply Wall St’s Community page, where millions of investors share their views. This helps you compare that fair value to today’s price so you can decide whether to buy or sell. The platform automatically updates your Narrative as new news or earnings arrive for Renault. It can reveal, for example, how one investor’s cautiously revised view might still support a fair value of around €49 per share, while another, more optimistic forecast points closer to €63. This illustrates how different but clearly explained perspectives can coexist and offer a more transparent framework for your own decision.
Do you think there's more to the story for Renault? Head over to our Community to see what others are saying!
This article by Simply Wall St is general in nature. We provide commentary based on historical data and analyst forecasts only using an unbiased methodology and our articles are not intended to be financial advice. It does not constitute a recommendation to buy or sell any stock, and does not take account of your objectives, or your financial situation. We aim to bring you long-term focused analysis driven by fundamental data. Note that our analysis may not factor in the latest price-sensitive company announcements or qualitative material. Simply Wall St has no position in any stocks mentioned.
Have feedback on this article? Concerned about the content? Get in touch with us directly. Alternatively, email editorial-team@simplywallst.com