
 Nasdaq
 华尔街日报
华尔街日报Is Shopify’s Valuation Justified After Its 2025 Rally and Ecosystem Expansion?
- If you are wondering whether Shopify is still worth buying after its huge run, or if the easy money has already been made, you are not the only one trying to figure out whether the current price makes sense.
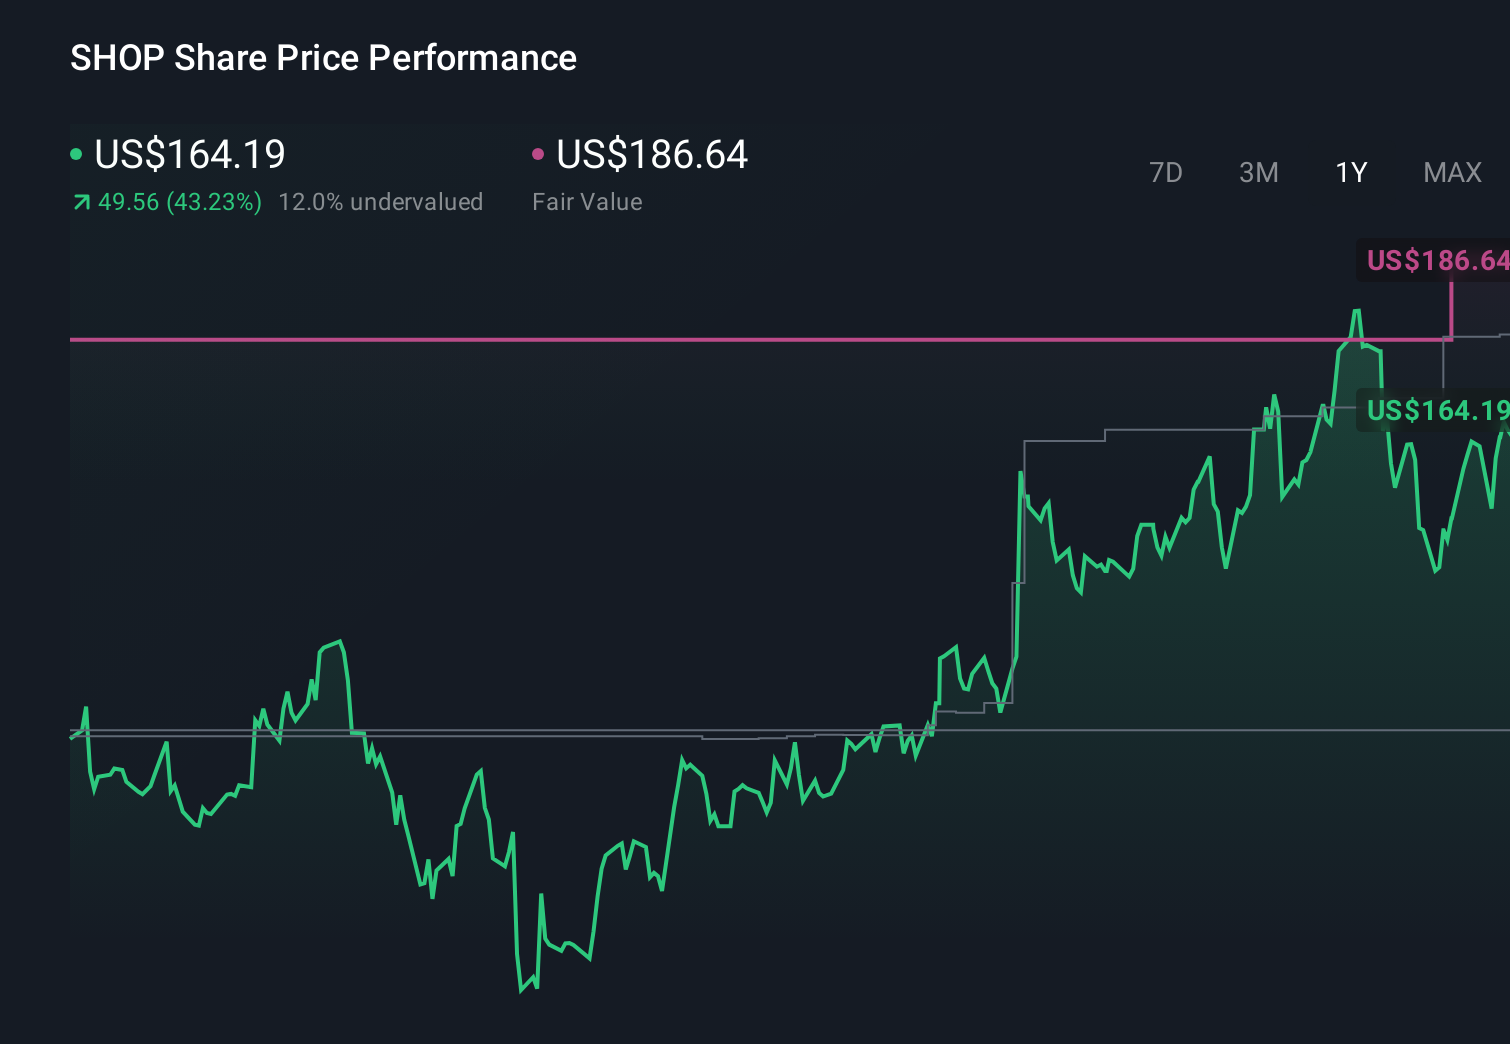
- Over the last week the stock is up 3.8%. It has climbed 6.0% in the last month, 56.6% year to date, and 46.1% over the past year, while sitting around a recent close of $168.42.
- These gains have been supported by ongoing headlines around Shopify expanding its ecosystem, from partnerships that deepen its role in online retail to steady product improvements that keep merchants tied into the platform. At the same time, investors are debating how much long term growth is already priced in, as the company focuses on tools that help sellers scale globally and use data more effectively.
- Despite that excitement, Shopify currently scores just 0/6 on our undervaluation checks. This might surprise investors who see it as a long term compounder. Next, we will walk through several valuation approaches, and later in the article look at another way to think about what the market is really pricing in.
Shopify scores just 0/6 on our valuation checks. See what other red flags we found in the full valuation breakdown.
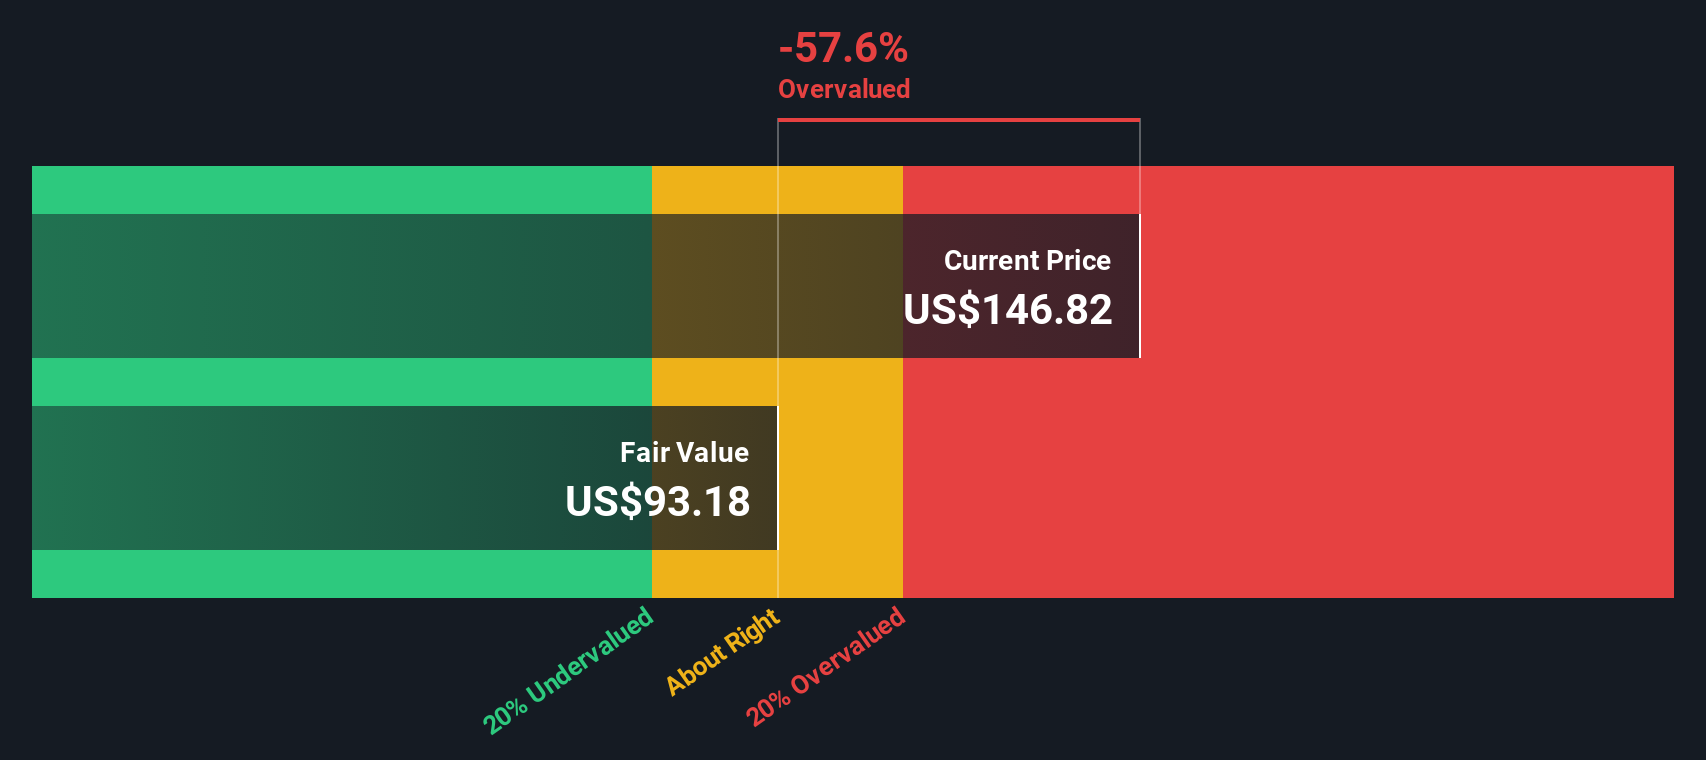
Approach 1: Shopify Discounted Cash Flow (DCF) Analysis
A Discounted Cash Flow, or DCF, model estimates what a business is worth by projecting its future cash flows and then discounting those back to today, to reflect the time value and risk of that money.
For Shopify, the model starts with last twelve month free cash flow of about $1.89 billion. Analysts and in house estimates expect this to rise steadily, with projected free cash flow of roughly $5.56 billion by 2029 and around $9.95 billion by 2035. This is based on a 2 stage Free Cash Flow to Equity framework that tapers growth over time.
When all those future cash flows are discounted back, the DCF suggests an intrinsic value of about $97.80 per share. Compared with the recent share price near $168.42, this implies the stock is roughly 72.2% overvalued on this metric. This indicates that a lot of future growth appears to be already priced in.
Result: OVERVALUED
Our Discounted Cash Flow (DCF) analysis suggests Shopify may be overvalued by 72.2%. Discover 906 undervalued stocks or create your own screener to find better value opportunities.
Approach 2: Shopify Price vs Earnings
For profitable companies like Shopify, the price to earnings, or PE, ratio is a useful yardstick because it directly links the share price to the profits that each share is entitled to. In simple terms, it tells you how many dollars investors are willing to pay today for one dollar of current earnings.
What counts as a normal or fair PE depends on how fast earnings are expected to grow and how risky that growth is. Higher expected growth and stronger competitive positions can justify a higher PE, while more uncertainty or weaker profitability should push the PE lower.
Shopify currently trades on a PE of about 123.1x, well above the broader IT industry average of roughly 31.1x and above its peer group average of around 38.7x. Simply Wall St also calculates a proprietary Fair Ratio of about 49.5x for Shopify, which reflects its specific mix of earnings growth, industry, profit margins, market cap and risk profile. This Fair Ratio is more informative than simple peer or industry comparisons because it is tailored to Shopify rather than a one size fits all benchmark. Comparing the Fair Ratio of 49.5x with the actual PE of 123.1x suggests the stock is trading at a substantial premium.
Result: OVERVALUED
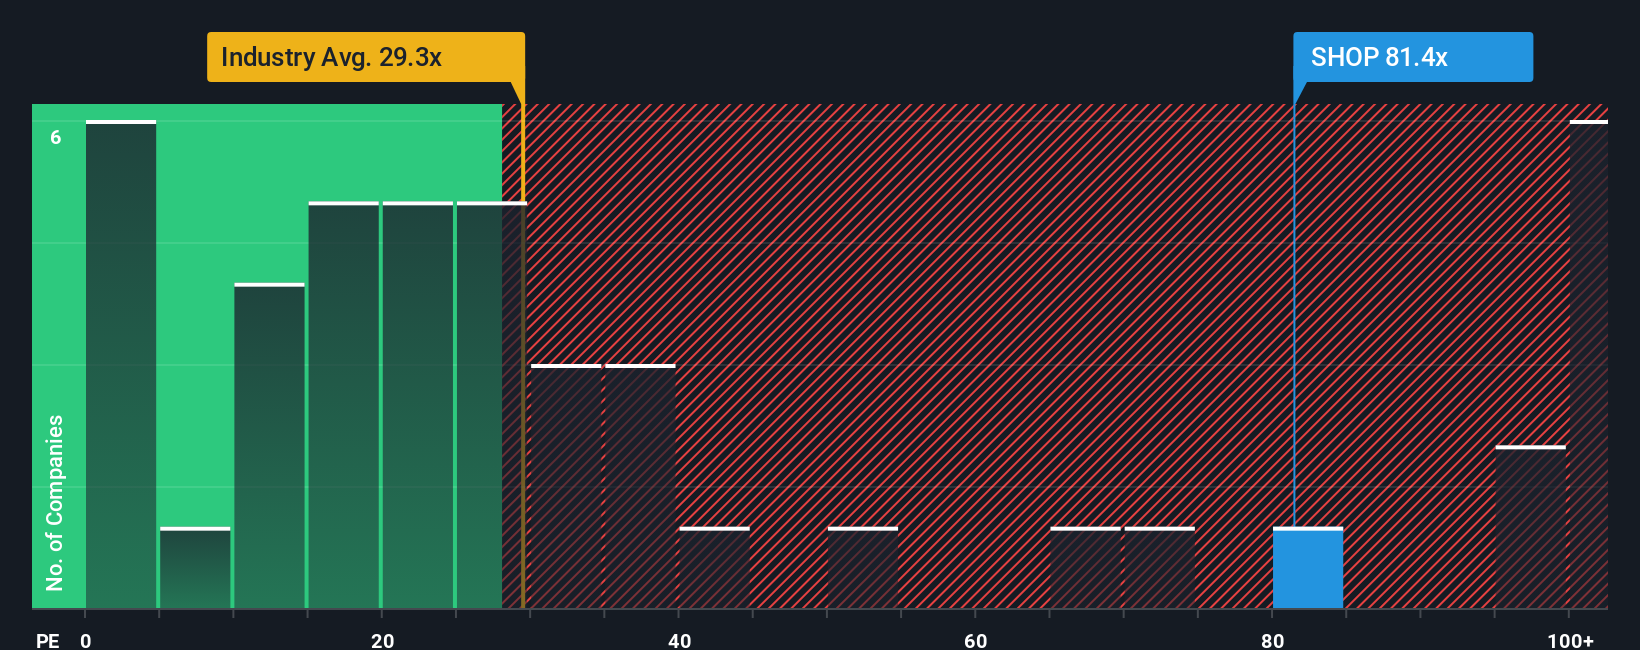
PE ratios tell one story, but what if the real opportunity lies elsewhere? Discover 1448 companies where insiders are betting big on explosive growth.
Upgrade Your Decision Making: Choose your Shopify Narrative
Earlier we mentioned that there is an even better way to understand valuation, so let us introduce you to Narratives, a simple way to connect your view of Shopify’s story with concrete numbers like future revenue, earnings, margins and ultimately a personal fair value estimate.
A Narrative is your own structured story, where you spell out what you think will drive Shopify’s business over time, translate that into a financial forecast, and then see the fair value that naturally falls out of those assumptions rather than relying only on static multiples.
On Simply Wall St, Narratives live in the Community page and are designed to be accessible, so you can quickly see how your fair value compares to today’s share price and use that gap to decide how Shopify fits into your portfolio.
Because Narratives are dynamically updated when new news, earnings, or guidance comes in, you can watch how your fair value moves over time and compare it with other investors, from those who think Shopify is worth closer to $114 based on more cautious growth and margin assumptions, to those who see stronger AI driven momentum and international expansion supporting values around $200 and beyond.
Do you think there's more to the story for Shopify? Head over to our Community to see what others are saying!
This article by Simply Wall St is general in nature. We provide commentary based on historical data and analyst forecasts only using an unbiased methodology and our articles are not intended to be financial advice. It does not constitute a recommendation to buy or sell any stock, and does not take account of your objectives, or your financial situation. We aim to bring you long-term focused analysis driven by fundamental data. Note that our analysis may not factor in the latest price-sensitive company announcements or qualitative material. Simply Wall St has no position in any stocks mentioned.
Have feedback on this article? Concerned about the content? Get in touch with us directly. Alternatively, email editorial-team@simplywallst.com