
 Nasdaq
 华尔街日报
华尔街日报Is It Too Late To Consider Rocket Lab After Its 130% 2025 Surge?
- If you are wondering whether Rocket Lab's huge gains still leave room for upside or if the stock is already priced for perfection, you are in the right place.
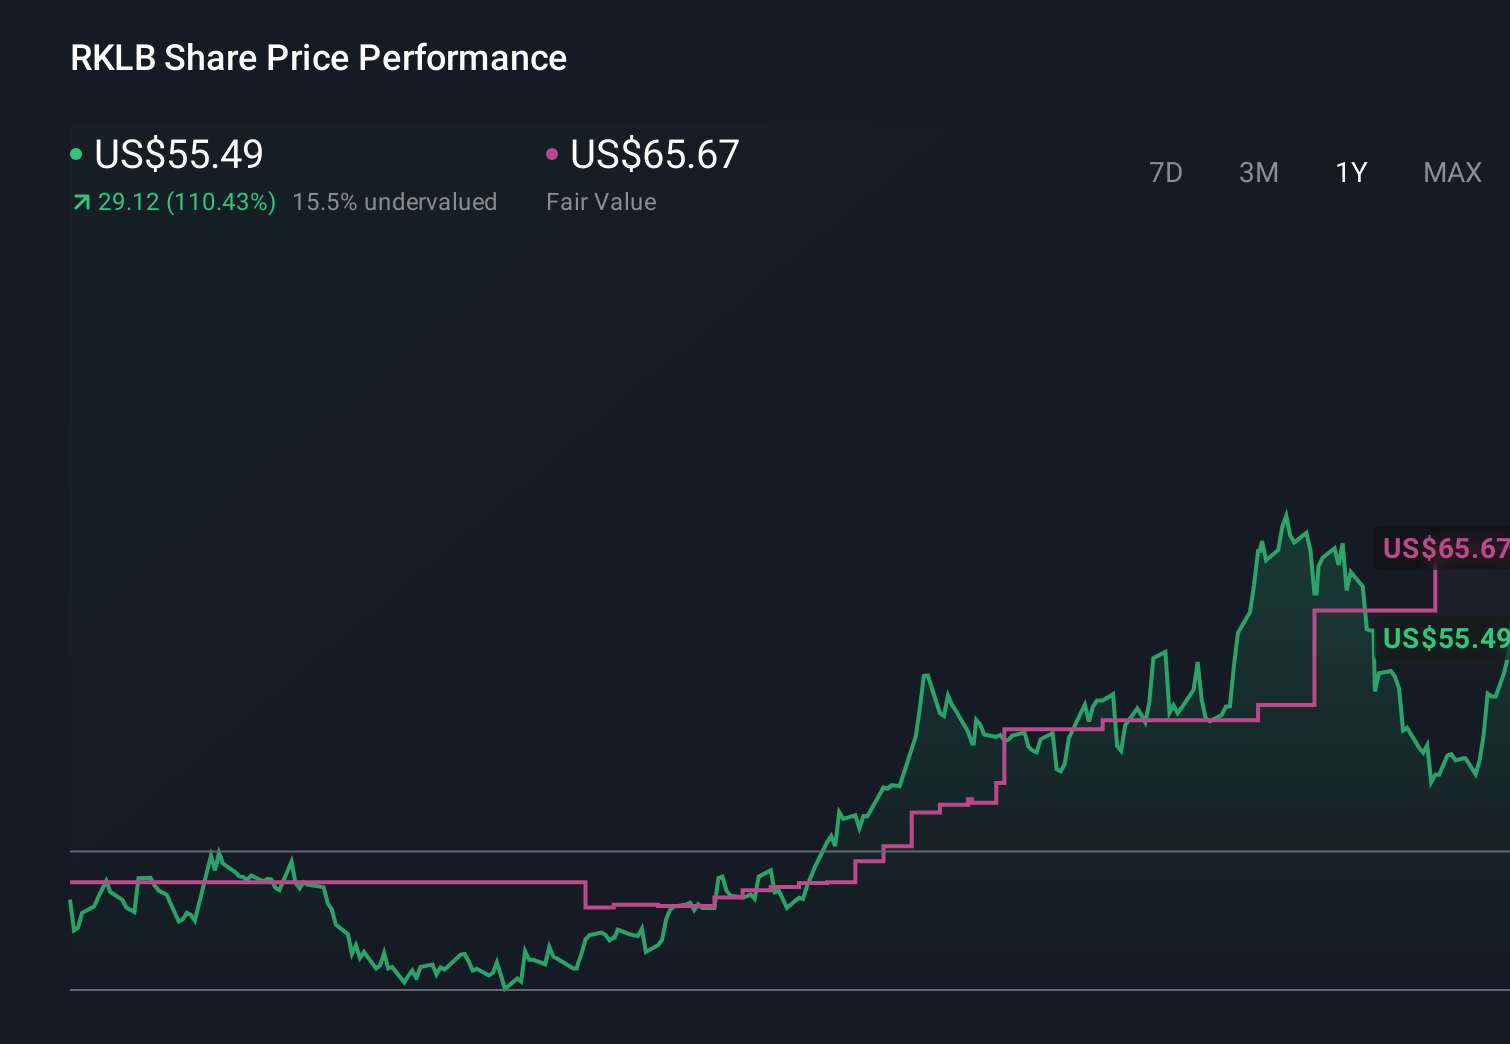
- The share price has rocketed recently, up 28.6% over the last week, 10.8% over the past month, and an eye catching 130.4% year to date, building on a staggering 1,296.1% three year run and 451.0% over five years.
- These moves have come as investors increasingly frame Rocket Lab as a key pure play on small launch and space infrastructure. There is growing attention on its expanding launch cadence and satellite services platform. At the same time, heightened market interest in space and defense related names has funneled more speculative and thematic capital toward the stock, amplifying each positive development.
- Despite all that excitement, Rocket Lab currently scores just 0/6 on our valuation checks, so in the sections that follow we will dig into what traditional valuation methods say about the stock, and then finish with a more intuitive way to think about what Rocket Lab might really be worth.
Rocket Lab scores just 0/6 on our valuation checks. See what other red flags we found in the full valuation breakdown.
Approach 1: Rocket Lab Discounted Cash Flow (DCF) Analysis
A Discounted Cash Flow model estimates what a company is worth by projecting its future cash flows and discounting them back to today in dollar terms. For Rocket Lab, the model used is a 2 Stage Free Cash Flow to Equity approach that starts with its latest twelve month free cash flow of about $220 million in the red, then assumes the business steadily moves into positive territory as it scales launches and space systems.
Analyst and internal projections see free cash flow improving to roughly $612 million by 2029, with further growth extending out to around $1.34 billion by 2035. Simply Wall St extrapolates beyond the first few analyst covered years to build a full 10 year path, then discounts each year’s cash flow back to today to estimate what the equity should be worth.
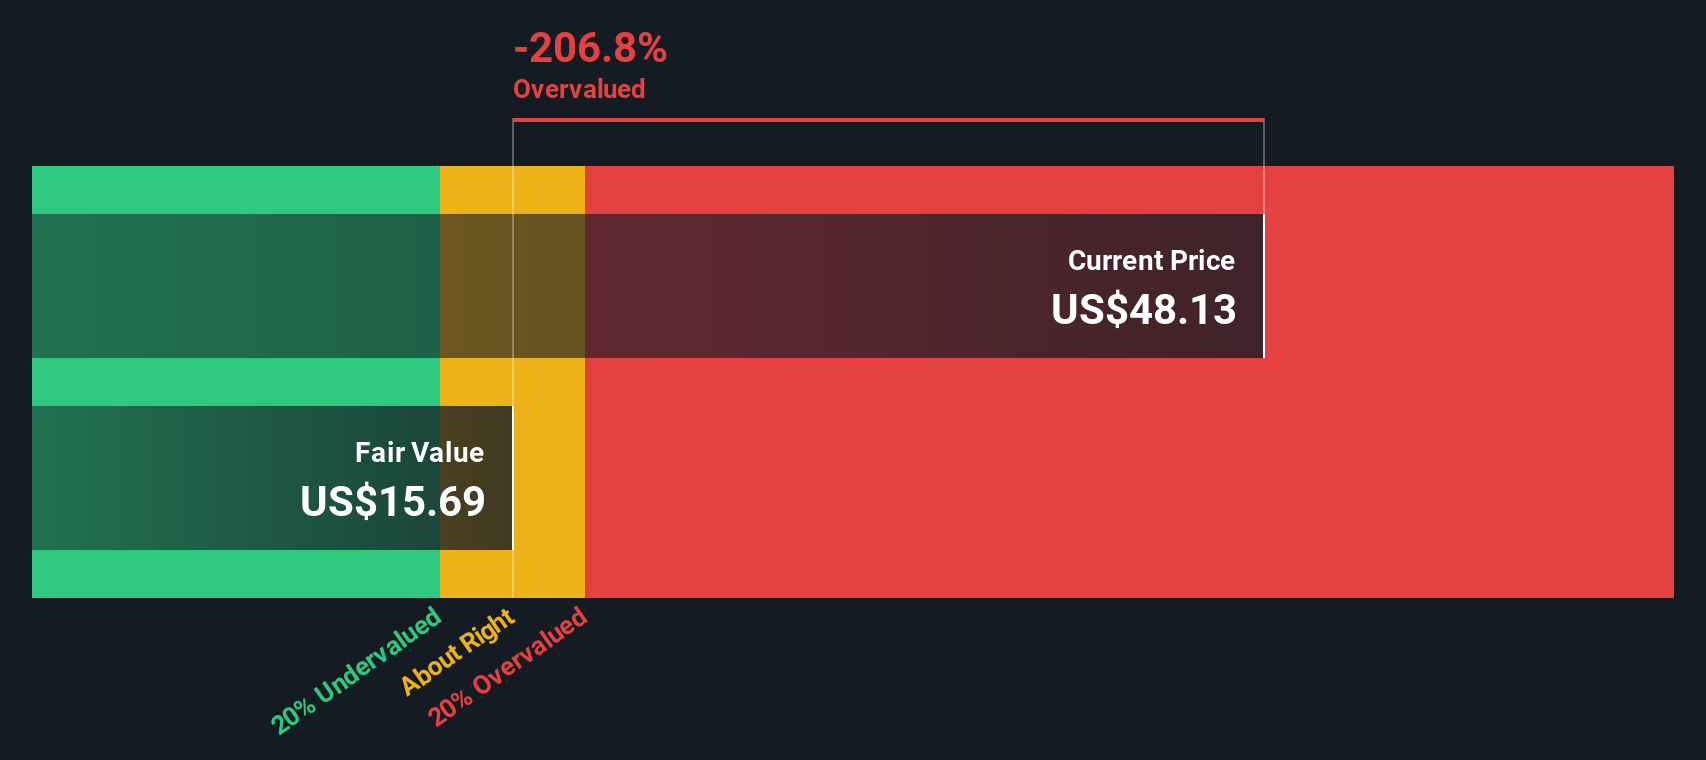
This DCF framework produces an intrinsic value of about $37.82 per share. Given that this implies Rocket Lab is roughly 52.1% overvalued versus its current share price, the model points to a stock that already reflects very optimistic growth assumptions.
Result: OVERVALUED
Our Discounted Cash Flow (DCF) analysis suggests Rocket Lab may be overvalued by 52.1%. Discover 905 undervalued stocks or create your own screener to find better value opportunities.
Approach 2: Rocket Lab Price vs Book
For companies that are still loss making or volatile on earnings, valuation often leans more on asset based measures like the price to book ratio, which compares the market value of the equity to the net assets on the balance sheet. In principle, faster growth and lower perceived risk justify investors paying a higher multiple of book value, while slower growth or higher risk should push that multiple closer to or even below the industry norm.
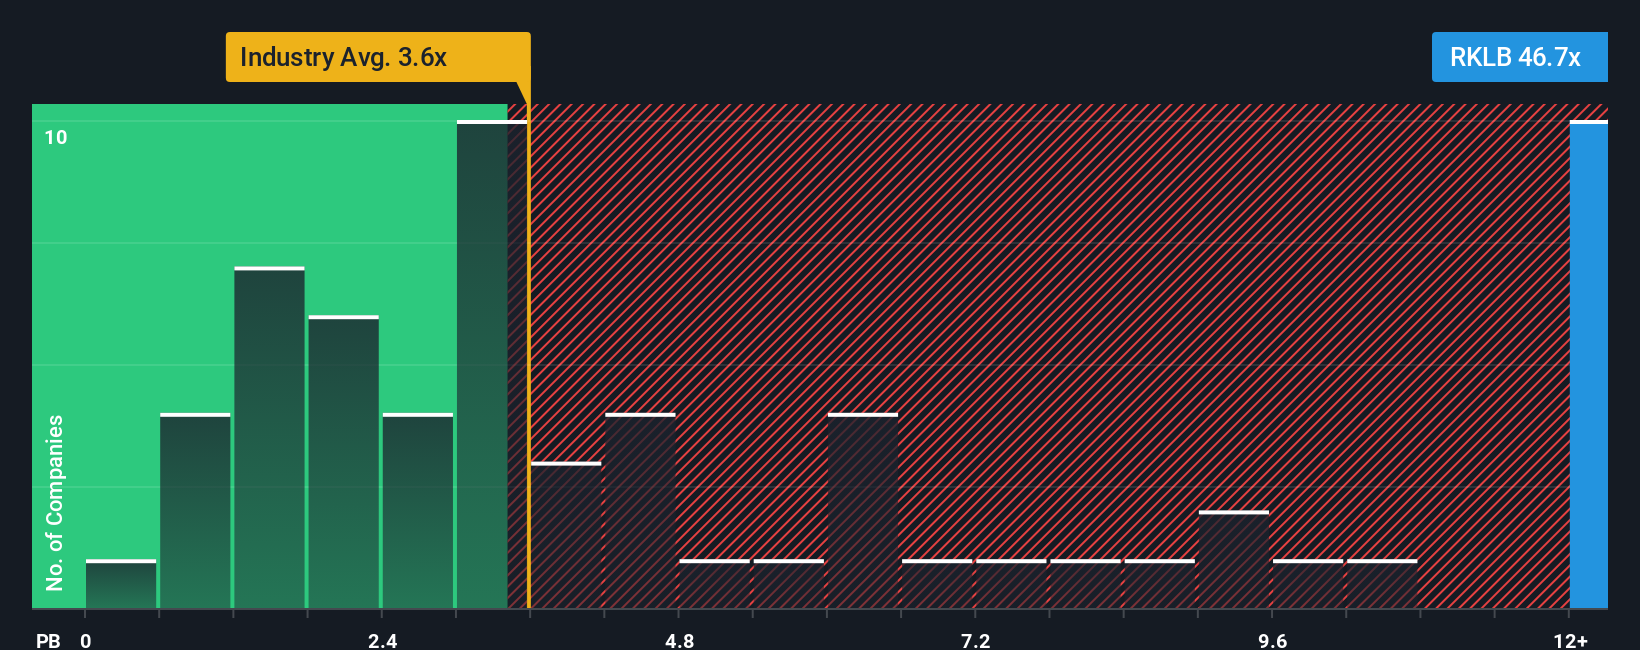
Rocket Lab currently trades at about 23.99x book value, far above both the Aerospace and Defense industry average of 3.52x and the peer group average of around 9.01x. Simply Wall St’s proprietary Fair Ratio framework refines this comparison by asking what price to book multiple would be reasonable once you factor in Rocket Lab’s specific growth outlook, profitability profile, risk characteristics, size and industry dynamics. Because it is tailored to the company, this Fair Ratio is more informative than broad peer or sector averages, which can mix very different business models and risk profiles.
On this basis, Rocket Lab’s current valuation screens as stretched relative to what the Fair Ratio would suggest is reasonable.
Result: OVERVALUED
PB ratios tell one story, but what if the real opportunity lies elsewhere? Discover 1448 companies where insiders are betting big on explosive growth.
Upgrade Your Decision Making: Choose your Rocket Lab Narrative
Earlier we mentioned that there is an even better way to understand valuation, so let us introduce you to Narratives, a simple tool on Simply Wall St’s Community page that lets you turn your view of a company into a story linked to a financial forecast and a fair value. You can enter assumptions about Rocket Lab’s future revenue, earnings and margins, then compare the resulting Fair Value to today’s Price to help inform whether you might consider buying or selling. Those Narratives automatically update as new news or earnings arrive. For example, one investor might build a conservative Rocket Lab Narrative around a fair value near $31.72 with moderate growth and careful risk management, while another builds a high conviction growth Narrative closer to $65.67 that assumes faster launch cadence, stronger margins and a larger share of the space economy. This shows how different but clearly structured stories can coexist around the same stock and gives you an accessible, dynamic framework for your own decision making.
For Rocket Lab however we will make it really easy for you with previews of two leading Rocket Lab Narratives:
Fair value: $65.67 per share
Implied undervaluation: -12.4%
Expected annual revenue growth: 36.36%
- Positions Rocket Lab as a vertically integrated, end to end space solutions provider, using acquisitions like Geost and in house satellite production to capture larger defense and national security contracts and support higher margins over time.
- Assumes strong multi year revenue growth from rising Electron launch cadence, growing Space Systems demand and eventual Neutron ramp, with margins turning positive as R&D and capex give way to scaled production.
- Flags key risks around sustained cash burn, dependence on large government contracts, Neutron execution and competition from SpaceX, but concludes that at scale the business can generate durable cash flows that justify a premium valuation.
Fair value: $31.72 per share
Implied overvaluation: 81.3%
Expected annual revenue growth: 30.0%
- Frames Rocket Lab as a key player in the $800 billion space backbone but argues that hitting long term revenue targets, such as $6 billion by 2035, requires flawless execution on Neutron, high launch cadence and sustained growth in higher margin Space Systems.
- Emphasizes that Neutron is a pivotal, binary risk, with success potentially enabling competitive, reusable medium lift launches, but failure threatening the entire investment case given ongoing cash burn and the need to reach positive net margins.
- Highlights intense competitive and geopolitical context, particularly versus SpaceX, and stresses that investors must weigh execution risk, capital discipline and contract dynamics carefully, as today’s price already bakes in a very optimistic share of the future space economy.
Do you think there's more to the story for Rocket Lab? Head over to our Community to see what others are saying!
This article by Simply Wall St is general in nature. We provide commentary based on historical data and analyst forecasts only using an unbiased methodology and our articles are not intended to be financial advice. It does not constitute a recommendation to buy or sell any stock, and does not take account of your objectives, or your financial situation. We aim to bring you long-term focused analysis driven by fundamental data. Note that our analysis may not factor in the latest price-sensitive company announcements or qualitative material. Simply Wall St has no position in any stocks mentioned.
Have feedback on this article? Concerned about the content? Get in touch with us directly. Alternatively, email editorial-team@simplywallst.com