
 Nasdaq
 华尔街日报
华尔街日报Energy Services of America (ESOA) Margin Collapse Challenges Bullish Growth and Valuation Narratives
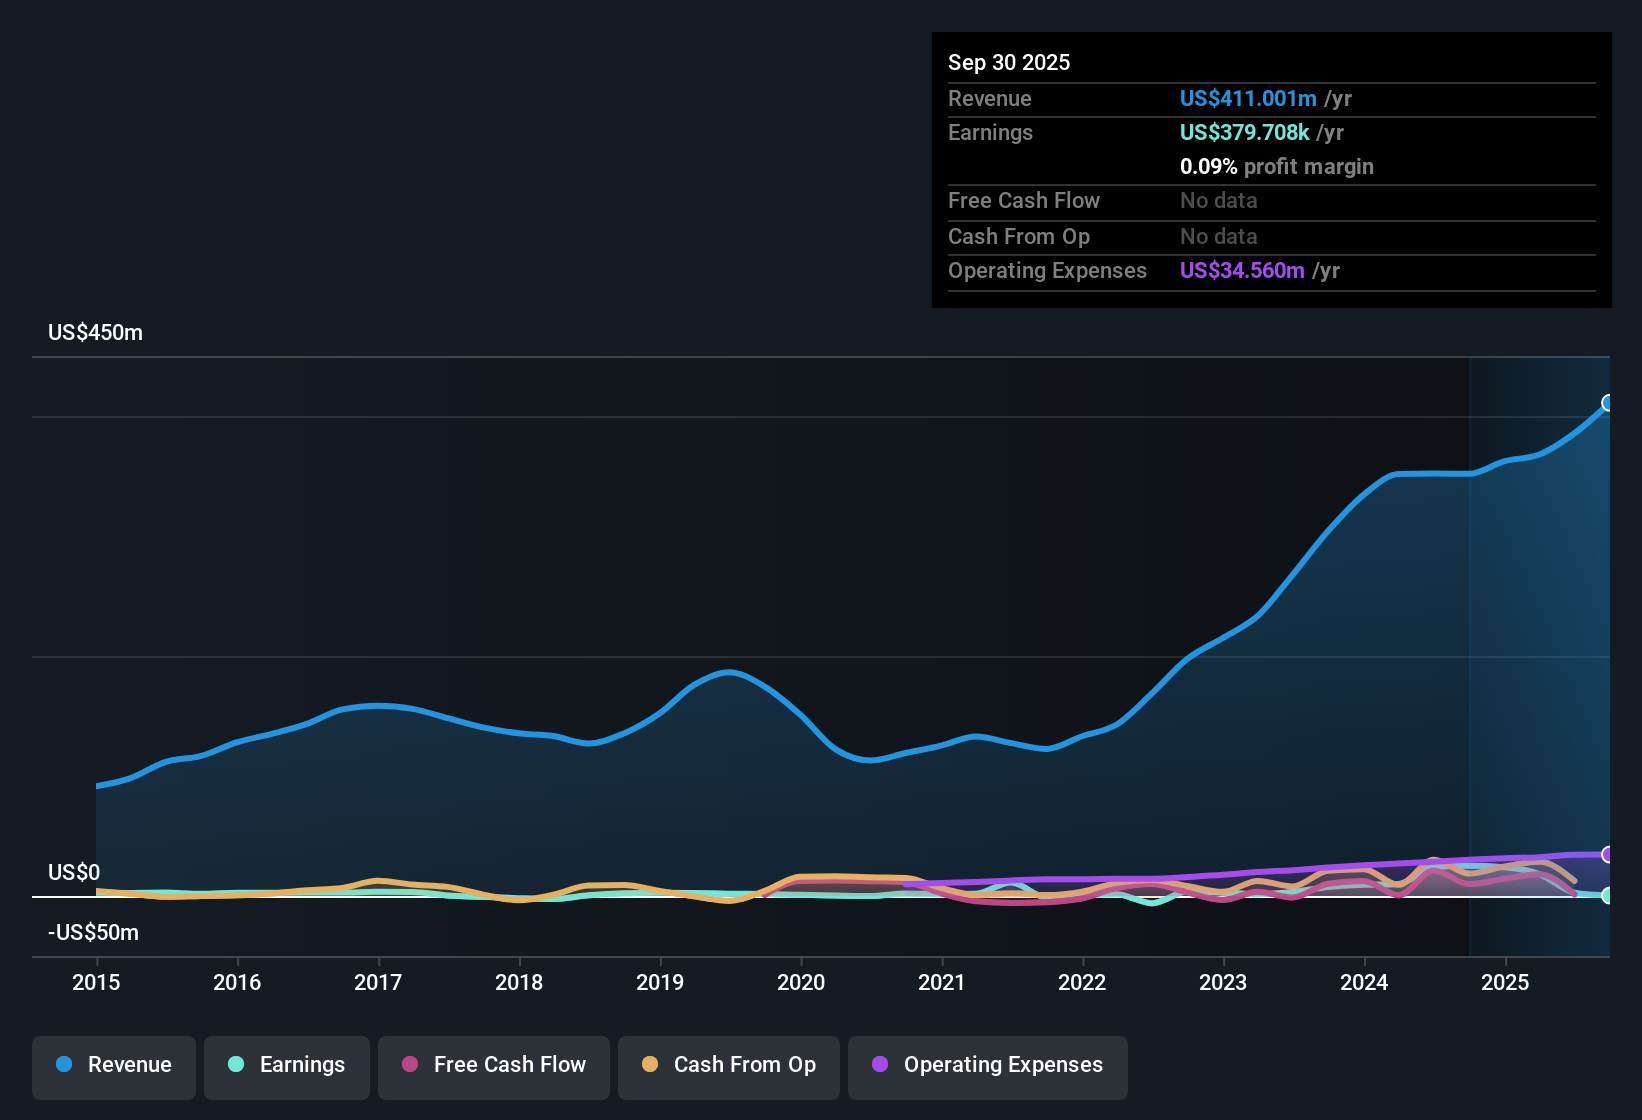
Energy Services of America (ESOA) just posted its FY 2025 third quarter numbers, with revenue of about $103.6 million and EPS of roughly $0.13, while trailing twelve month revenue sits near $385.6 million and EPS at about $0.17. The company has seen revenue move from roughly $85.9 million and EPS of about $1.06 in the third quarter of FY 2024 to $103.6 million and $0.13 respectively in the latest quarter, setting up a picture where the headline growth story now runs alongside much thinner margins and more volatile earnings.
See our full analysis for Energy Services of America.With the scorecard on the table, the next step is to line these results up against the prevailing narratives around ESOA to see which stories the numbers support and which ones they start to challenge.
Curious how numbers become stories that shape markets? Explore Community Narratives
Margins Shrink as TTM Net Profit Drops to 0.7%
- On a trailing twelve month basis, ESOA generated about $385.6 million in revenue but only around $2.8 million in net income, which works out to a net margin of roughly 0.7% compared with 6.9% a year earlier.
- What stands out for the bearish view is how this thinner profitability sits alongside strong past and forecast earnings growth, creating a clear tension:
- Over the last five years, earnings have grown a robust 48.9% per year and are forecast to rise another 27.1% per year. Yet the latest year shows that only a small slice of the $385.6 million in sales is currently dropping to the bottom line.
- Critics highlight that the drop from a 6.9% margin to 0.7% means recent profitability looks far less durable, even though top line revenue has climbed from about $351.9 million to $385.6 million over the same period.
Valuation Stretched Versus 52.3x P E
- ESOA trades on a trailing P E of about 52.3 times, well above both peer and industry averages of roughly 19.2 times and 18.2 times, despite its trailing net margin being just 0.7%.
- From a bearish angle, this rich multiple is hard to square with the recent earnings profile, which makes the stock look fully priced on this one metric:
- Compared with the industry on roughly 18 to 19 times earnings, investors are paying nearly three times as much for each dollar of ESOA’s trailing earnings even though its margin has moved down from 6.9% to 0.7% over the past year.
- At the same time, the share price of $8.78 is far below the DCF fair value estimate of about $31.56, so skeptics need to reconcile a high earnings multiple with a valuation model that points to large upside if earnings forecasts are met.
DCF Fair Value of 31.56 vs 8.78 Price
- A DCF fair value of roughly $31.56 per share sits well above the current $8.78 share price, while earnings are expected to grow around 27.1% per year and revenue about 7.6% per year.
- Supporters see this spread as a strong bullish signal, but the numbers also show where the story needs to improve for that upside to play out:
- The bullish case leans on that 27.1% forecast earnings growth and the historical 48.9% annual earnings growth, arguing that the current 0.7% trailing margin and weak interest coverage are short term issues that future profitability can repair.
- What is equally important is that interest expenses are not well covered by earnings today, so even with a large gap between DCF fair value and the market price, the company must translate its $385.6 million in trailing revenue into stronger net income to justify closing that valuation gap.
Next Steps
Don't just look at this quarter; the real story is in the long-term trend. We've done an in-depth analysis on Energy Services of America's growth and its valuation to see if today's price is a bargain. Add the company to your watchlist or portfolio now so you don't miss the next big move.
See What Else Is Out There
Energy Services of America’s razor thin margins, volatile earnings, and weak interest coverage raise questions about how resilient its profitability and balance sheet really are.
If those fragilities concern you, use our solid balance sheet and fundamentals stocks screener (1939 results) to quickly find financially stronger companies built on healthier leverage, steadier earnings, and balance sheets designed to weather tougher conditions.
This article by Simply Wall St is general in nature. We provide commentary based on historical data and analyst forecasts only using an unbiased methodology and our articles are not intended to be financial advice. It does not constitute a recommendation to buy or sell any stock, and does not take account of your objectives, or your financial situation. We aim to bring you long-term focused analysis driven by fundamental data. Note that our analysis may not factor in the latest price-sensitive company announcements or qualitative material. Simply Wall St has no position in any stocks mentioned.
Have feedback on this article? Concerned about the content? Get in touch with us directly. Alternatively, email editorial-team@simplywallst.com