
 Nasdaq
 华尔街日报
华尔街日报Assessing Patterson-UTI After a Tough 2024 and Bullish Cash Flow Projections
- If you are wondering whether Patterson-UTI Energy is a beaten down bargain or a value trap, you are not alone. This stock sits in that sweet spot where pessimism might be masking opportunity.
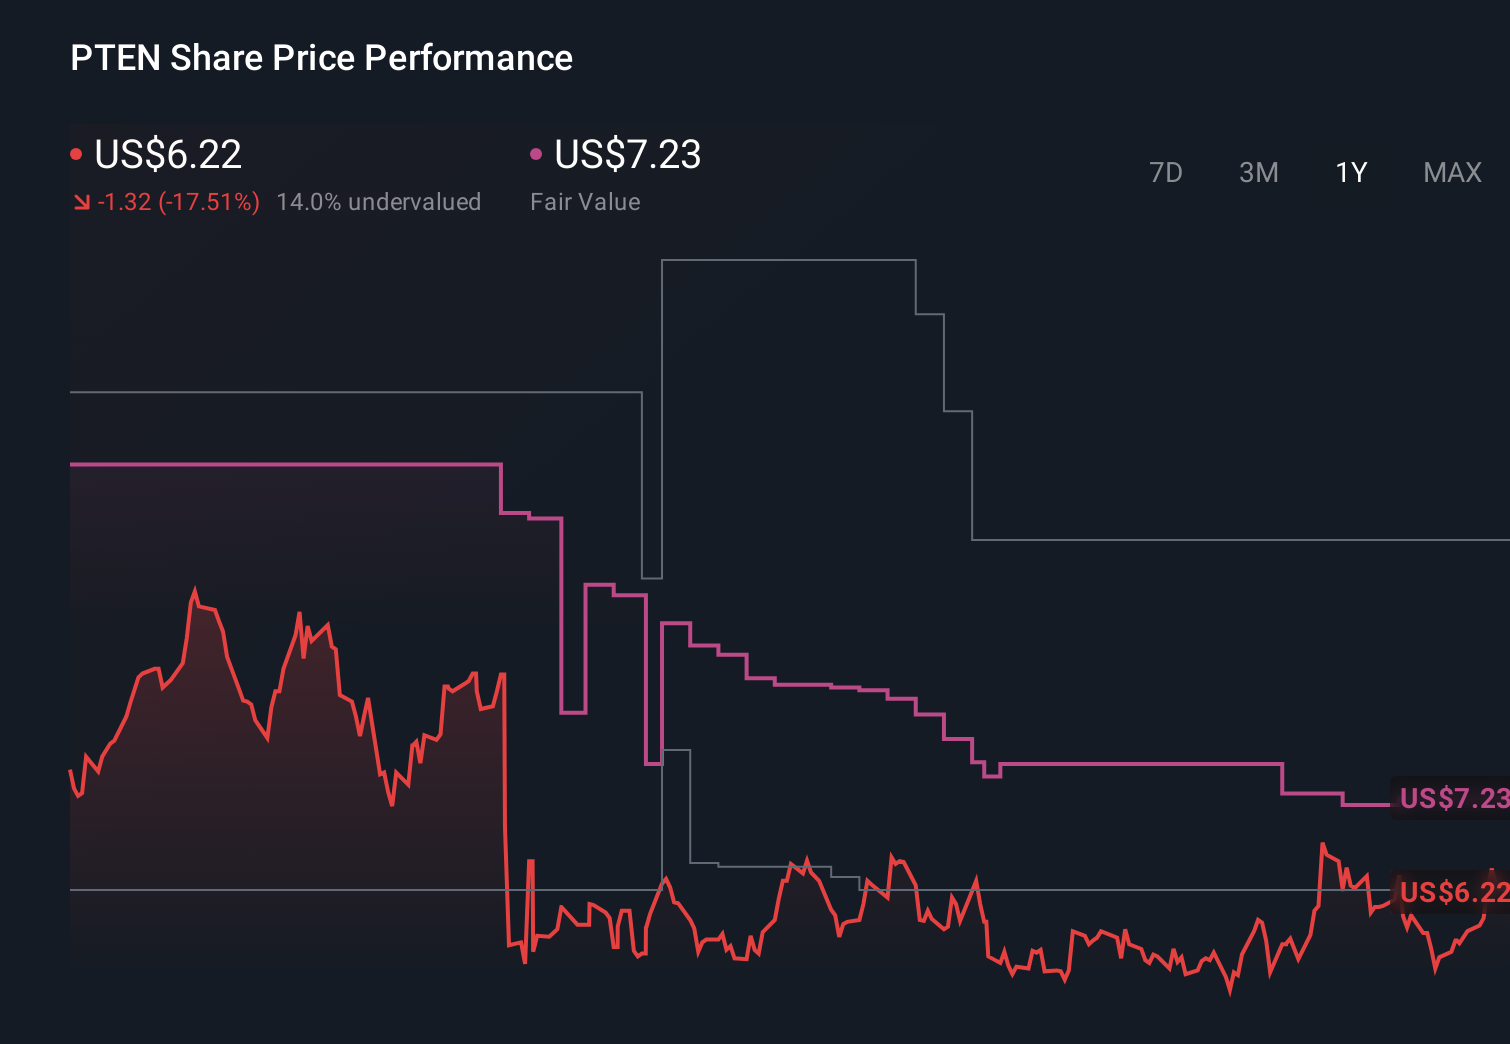
- The share price has inched up 2.7% over the last week and 4.9% over the past month, but it is still down 24.4% year to date and 13.0% over the last year, which suggests sentiment has been bruised for a while.
- Recently, investors have been reacting to shifting expectations around North American drilling activity and tight capital discipline across the shale patch, both of which directly influence Patterson-UTI's contract volumes and pricing power. There has also been renewed discussion about consolidation in the oilfield services space, which tends to spotlight companies like Patterson-UTI as potential beneficiaries if activity and pricing improve.
- On our checks, Patterson-UTI scores a 5/6 valuation score, which suggests the market may be underestimating its underlying cash flows and asset base. Next, we will walk through the different valuation approaches behind that number and, toward the end of the article, explore a more intuitive way to think about what this stock might really be worth.
Find out why Patterson-UTI Energy's -13.0% return over the last year is lagging behind its peers.
Approach 1: Patterson-UTI Energy Discounted Cash Flow (DCF) Analysis
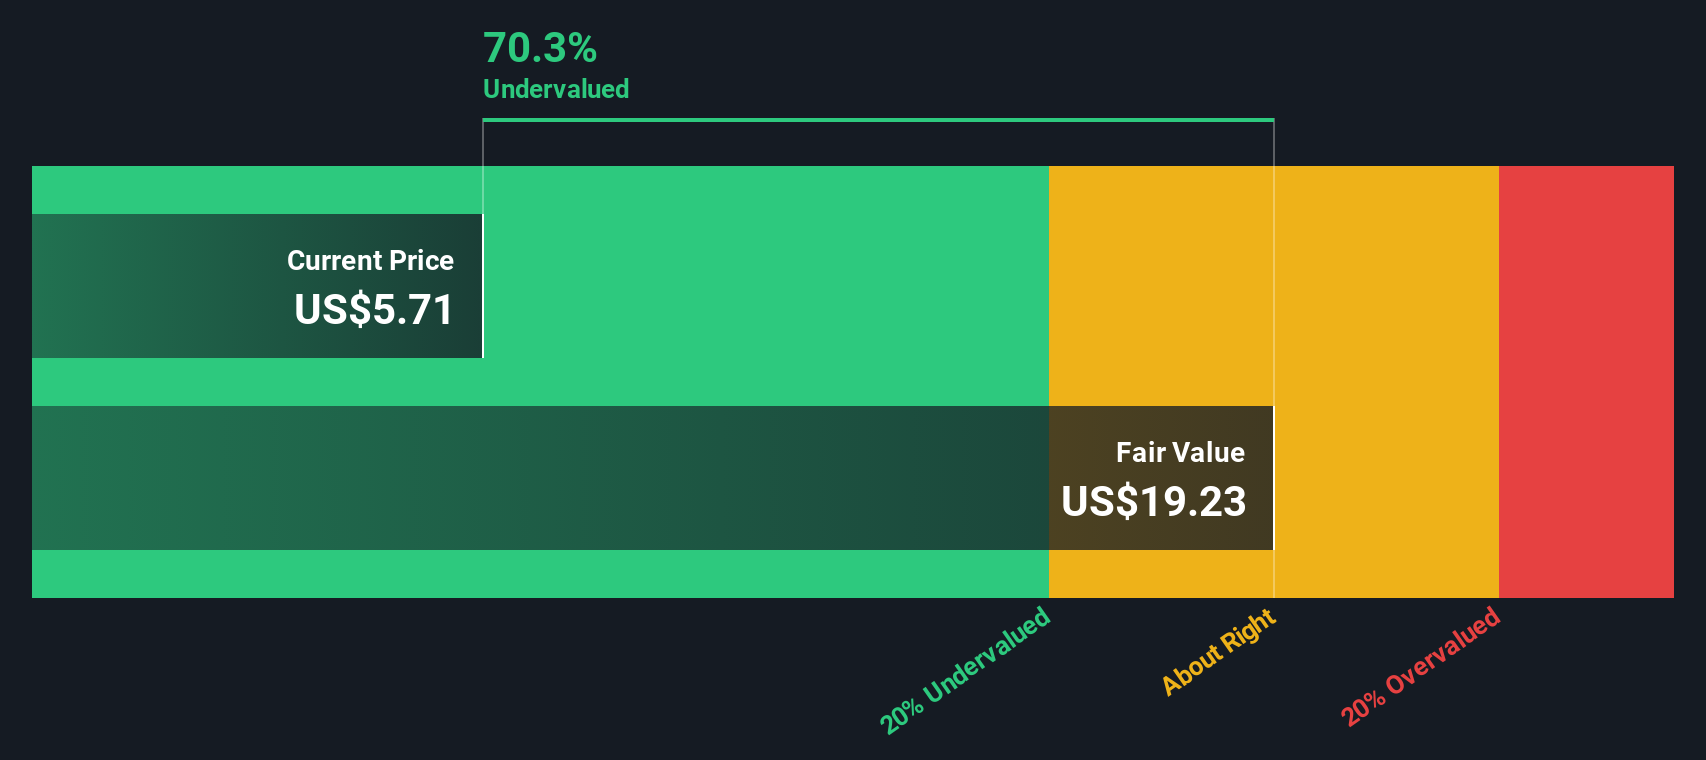
The Discounted Cash Flow model projects a company’s future cash flows and then discounts them back into today’s dollars to estimate what the business is worth right now. For Patterson-UTI Energy, the model starts with last twelve month Free Cash Flow of about $234.9 million and uses analyst forecasts for the next few years, then extrapolates further out based on expected growth patterns.
Under this 2 Stage Free Cash Flow to Equity approach, Patterson-UTI’s Free Cash Flow is projected to rise to roughly $615.4 million in 10 years. All of these cash flows are discounted back to today, producing an estimated intrinsic value of about $24.30 per share. Compared with the current market price, this implies the stock is trading at roughly a 73.5% discount to its DCF value. This suggests that investors are heavily discounting the company’s future earnings power.
On this model, Patterson-UTI appears meaningfully mispriced in a positive way.
Result: UNDERVALUED
Our Discounted Cash Flow (DCF) analysis suggests Patterson-UTI Energy is undervalued by 73.5%. Track this in your watchlist or portfolio, or discover 906 more undervalued stocks based on cash flows.
Approach 2: Patterson-UTI Energy Price vs Sales
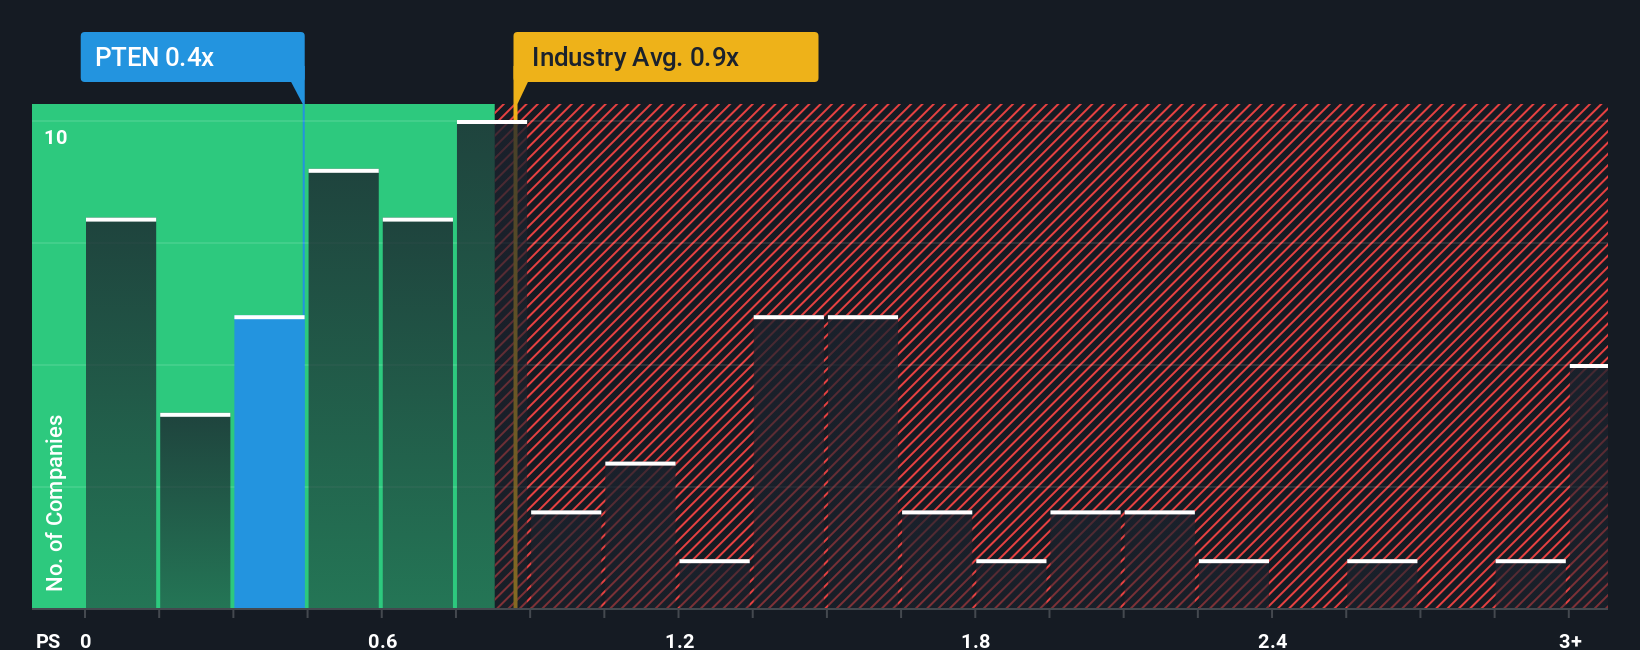
For companies where earnings can swing with the cycle, the price to sales ratio is often a cleaner way to compare valuations because revenue tends to be more stable than profits. Investors typically pay higher sales multiples for businesses with stronger growth prospects and lower perceived risk, and accept lower multiples when growth is modest or the outlook is more uncertain.
Patterson-UTI Energy currently trades on a price to sales ratio of about 0.51x. That is well below both the Energy Services industry average of roughly 1.14x and the peer group average of around 1.39x, suggesting the market is assigning a discount to the company’s revenue base. Simply Wall St’s proprietary Fair Ratio for Patterson-UTI, however, is 0.64x, which reflects what investors might reasonably pay for the stock once factors like expected growth, profitability, industry, market cap and specific risks are accounted for.
This Fair Ratio is more informative than a simple comparison with peers or the sector because it adjusts for the company’s own fundamentals rather than assuming it should trade exactly like its rivals. With the actual price to sales ratio at 0.51x compared with a Fair Ratio of 0.64x, Patterson-UTI appears attractively valued on this metric.
Result: UNDERVALUED
PS ratios tell one story, but what if the real opportunity lies elsewhere? Discover 1448 companies where insiders are betting big on explosive growth.
Upgrade Your Decision Making: Choose your Patterson-UTI Energy Narrative
Earlier we mentioned that there is an even better way to understand valuation, so let us introduce you to Narratives, a simple way to connect your view of Patterson-UTI Energy’s business to a financial forecast and then to a fair value estimate. A Narrative is your story behind the numbers, capturing how you think revenue, earnings and margins will evolve based on factors like drilling activity, technology adoption and capital returns, and then translating that view into a projected fair value per share. On Simply Wall St’s Community page, used by millions of investors, Narratives are an easy, guided tool that let you compare this fair value with today’s share price so you can decide whether to buy, hold or sell, and they automatically update as new earnings reports, news or estimates come in. For example, one Patterson-UTI Energy Narrative might lean bullish, assuming stronger LNG driven demand, higher margins and a fair value closer to the more optimistic analyst target near 10 dollars, while a more cautious Narrative could emphasize equipment oversupply and softer activity, landing nearer the 6.25 dollar bear target, and you can see and challenge both views in one place.
Do you think there's more to the story for Patterson-UTI Energy? Head over to our Community to see what others are saying!
This article by Simply Wall St is general in nature. We provide commentary based on historical data and analyst forecasts only using an unbiased methodology and our articles are not intended to be financial advice. It does not constitute a recommendation to buy or sell any stock, and does not take account of your objectives, or your financial situation. We aim to bring you long-term focused analysis driven by fundamental data. Note that our analysis may not factor in the latest price-sensitive company announcements or qualitative material. Simply Wall St has no position in any stocks mentioned.
Have feedback on this article? Concerned about the content? Get in touch with us directly. Alternatively, email editorial-team@simplywallst.com