
 Nasdaq
 华尔街日报
华尔街日报Is It Too Late To Consider O'Reilly Automotive After Its Strong Multi Year Rally?
- If you are wondering whether O'Reilly Automotive is still attractive after its long run higher, or if the easy money has already been made, you are not alone. This breakdown is designed to cut through the noise and focus on what the stock may really be worth.
- Even after a recent pullback of about 4.4% over the last week and 3.9% over the last month, the stock is still up 19.0% year to date and 11.4% over the past year. That caps off a multi year climb of 73.6% in three years and 210.7% in five years.
- Those moves have been shaped by a steady stream of news around resilient auto parts demand and O'Reilly's ongoing expansion, including new store openings and continued investment in its distribution network. Investors are also paying attention to how the company is positioning itself against big box rivals and online competitors, which helps explain why the market has been willing to reward the stock over time.
- Despite its quality reputation, O'Reilly currently scores only a 1 out of 6 on our undervaluation checks. Below, we walk through discounted cash flow (DCF), multiples, and other common valuation approaches, then finish with a more intuitive way to think about value that can be even more useful than the models alone.
O'Reilly Automotive scores just 1/6 on our valuation checks. See what other red flags we found in the full valuation breakdown.
Approach 1: O'Reilly Automotive Discounted Cash Flow (DCF) Analysis
The Discounted Cash Flow model estimates what a business is worth today by projecting its future cash flows and discounting them back to the present. For O'Reilly Automotive, the model uses a 2 Stage Free Cash Flow to Equity approach built on cash flow projections.
O'Reilly generated around $1.66 billion in free cash flow over the last twelve months, and analysts expect this to grow steadily, with projections reaching roughly $3.20 billion by 2029. Beyond the initial analyst forecast window, Simply Wall St extrapolates cash flows further out, assuming gradually moderating growth as the company matures.
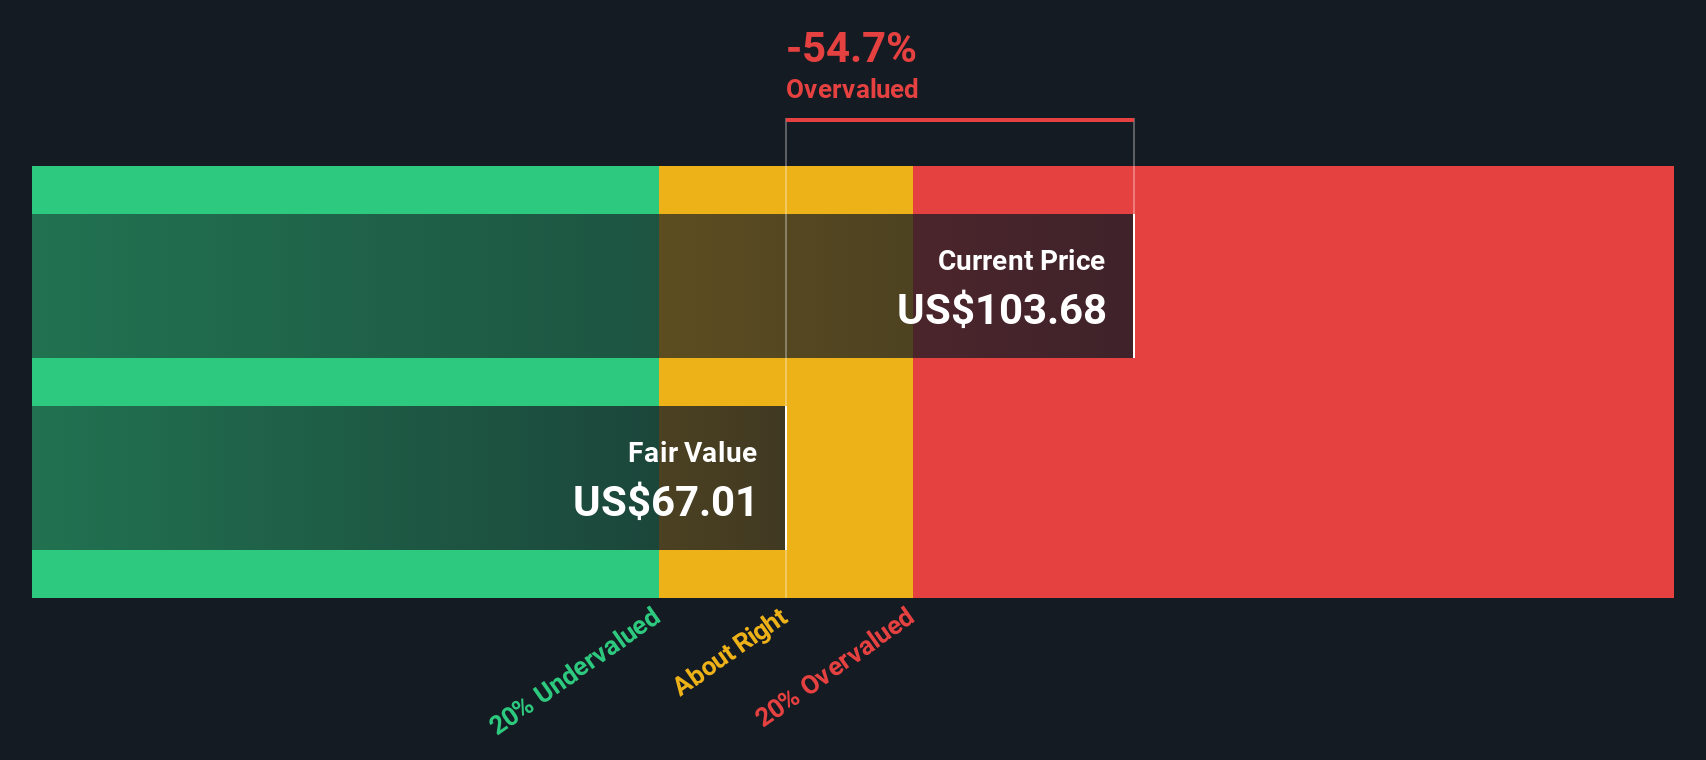
After discounting all those projected cash flows back to today in dollars, the model arrives at an estimated intrinsic value of about $65.49 per share. Compared with the current share price, this implies the stock is roughly 43.9% overvalued. This suggests investors are paying a meaningful premium to the cash flows currently expected.
Result: OVERVALUED
Our Discounted Cash Flow (DCF) analysis suggests O'Reilly Automotive may be overvalued by 43.9%. Discover 895 undervalued stocks or create your own screener to find better value opportunities.
Approach 2: O'Reilly Automotive Price vs Earnings
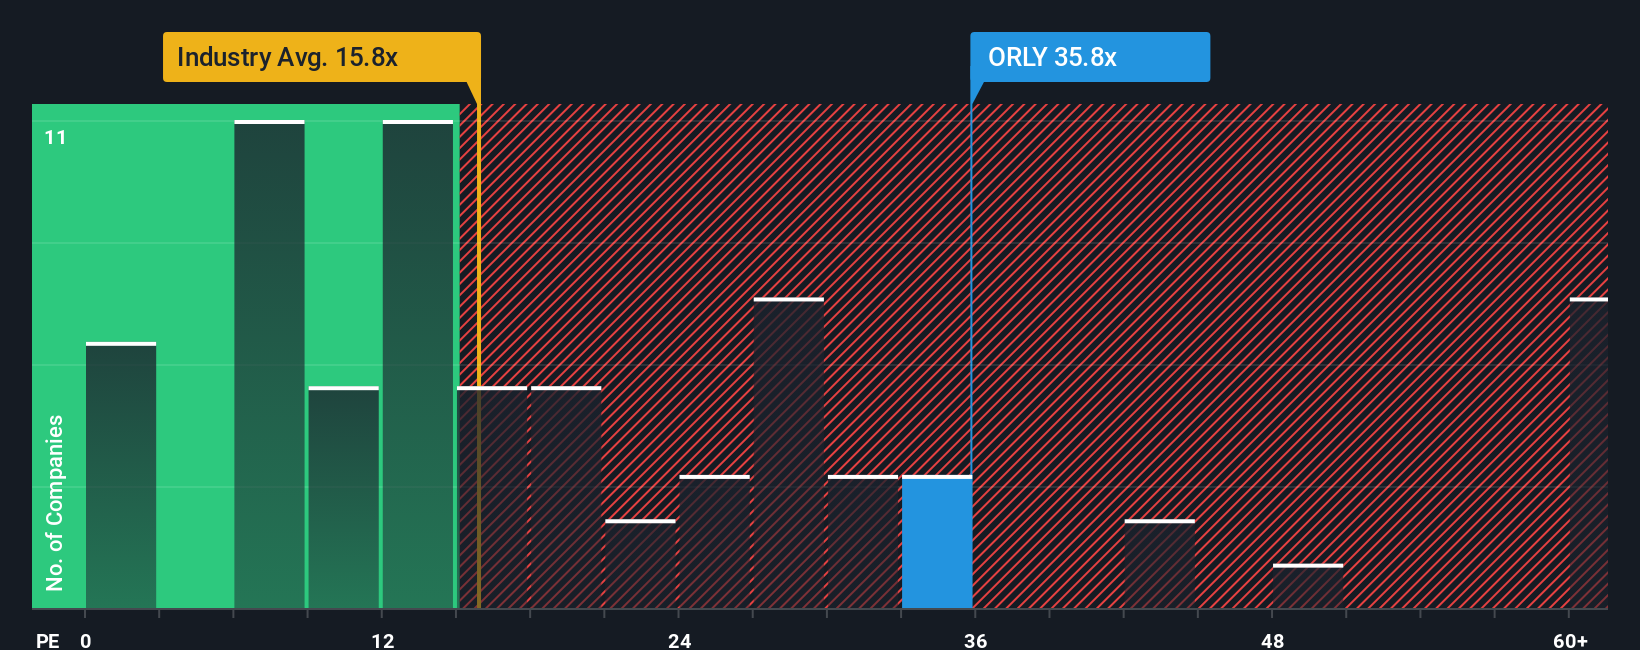
For profitable, established businesses like O'Reilly Automotive, the Price to Earnings (PE) ratio is a practical way to gauge value because it links what investors pay directly to the profits the company is generating today. In general, faster growth and lower perceived risk justify a higher PE, while slower growth or higher uncertainty warrant a lower, more conservative multiple.
O'Reilly currently trades on a PE of about 32.0x, above both the Specialty Retail industry average of roughly 19.4x and the peer group average of around 36.7x. To move beyond simple comparisons, Simply Wall St uses a proprietary Fair Ratio framework, which estimates what a reasonable PE should be after adjusting for factors like earnings growth, profitability, industry characteristics, company size, and risk profile. For O'Reilly, this Fair Ratio sits near 19.8x, implying investors are paying a substantial premium relative to what those fundamentals alone might justify. With the market multiple sitting well above this Fair Ratio, the PE based view lines up with the DCF output and points to the stock being overvalued at current levels.
Result: OVERVALUED
PE ratios tell one story, but what if the real opportunity lies elsewhere? Discover 1450 companies where insiders are betting big on explosive growth.
Upgrade Your Decision Making: Choose your O'Reilly Automotive Narrative
Earlier we mentioned that there is an even better way to understand valuation, so let us introduce you to Narratives, a simple way to attach your story about O'Reilly Automotive to the numbers by setting your own assumptions for future revenue, earnings, margins, and a fair value, then seeing how that story holds up. A Narrative connects three pieces together: the business story you believe, the financial forecast that flows from it, and the fair value that those cash flows imply. On Simply Wall St, millions of investors build and share these Narratives in the Community page, making it an easy and accessible tool to explore different viewpoints. Each Narrative continuously compares its fair value to the latest market price, helping you consider whether O'Reilly looks like a buy, a hold, or a sell at any given time, and it automatically updates when fresh information such as earnings or news is released. For example, one O'Reilly Narrative might lean bullish, assuming strong supply chain execution, mid single digit revenue growth, and a fair value of around $120 per share, while a more cautious Narrative might emphasize rising competition, modest growth, and a fair value closer to $62, illustrating how investors can reasonably disagree yet still stay disciplined.
Do you think there's more to the story for O'Reilly Automotive? Head over to our Community to see what others are saying!

This article by Simply Wall St is general in nature. We provide commentary based on historical data and analyst forecasts only using an unbiased methodology and our articles are not intended to be financial advice. It does not constitute a recommendation to buy or sell any stock, and does not take account of your objectives, or your financial situation. We aim to bring you long-term focused analysis driven by fundamental data. Note that our analysis may not factor in the latest price-sensitive company announcements or qualitative material. Simply Wall St has no position in any stocks mentioned.
Have feedback on this article? Concerned about the content? Get in touch with us directly. Alternatively, email editorial-team@simplywallst.com