
 Nasdaq
 华尔街日报
华尔街日报Is Charter Communications a Rare Bargain After a 44% Share Price Slide?
- Wondering if Charter Communications at around $204 a share is a value trap or a rare bargain hiding in plain sight? You are not the only one looking at this beaten up cable giant and asking if the downside has already been priced in.
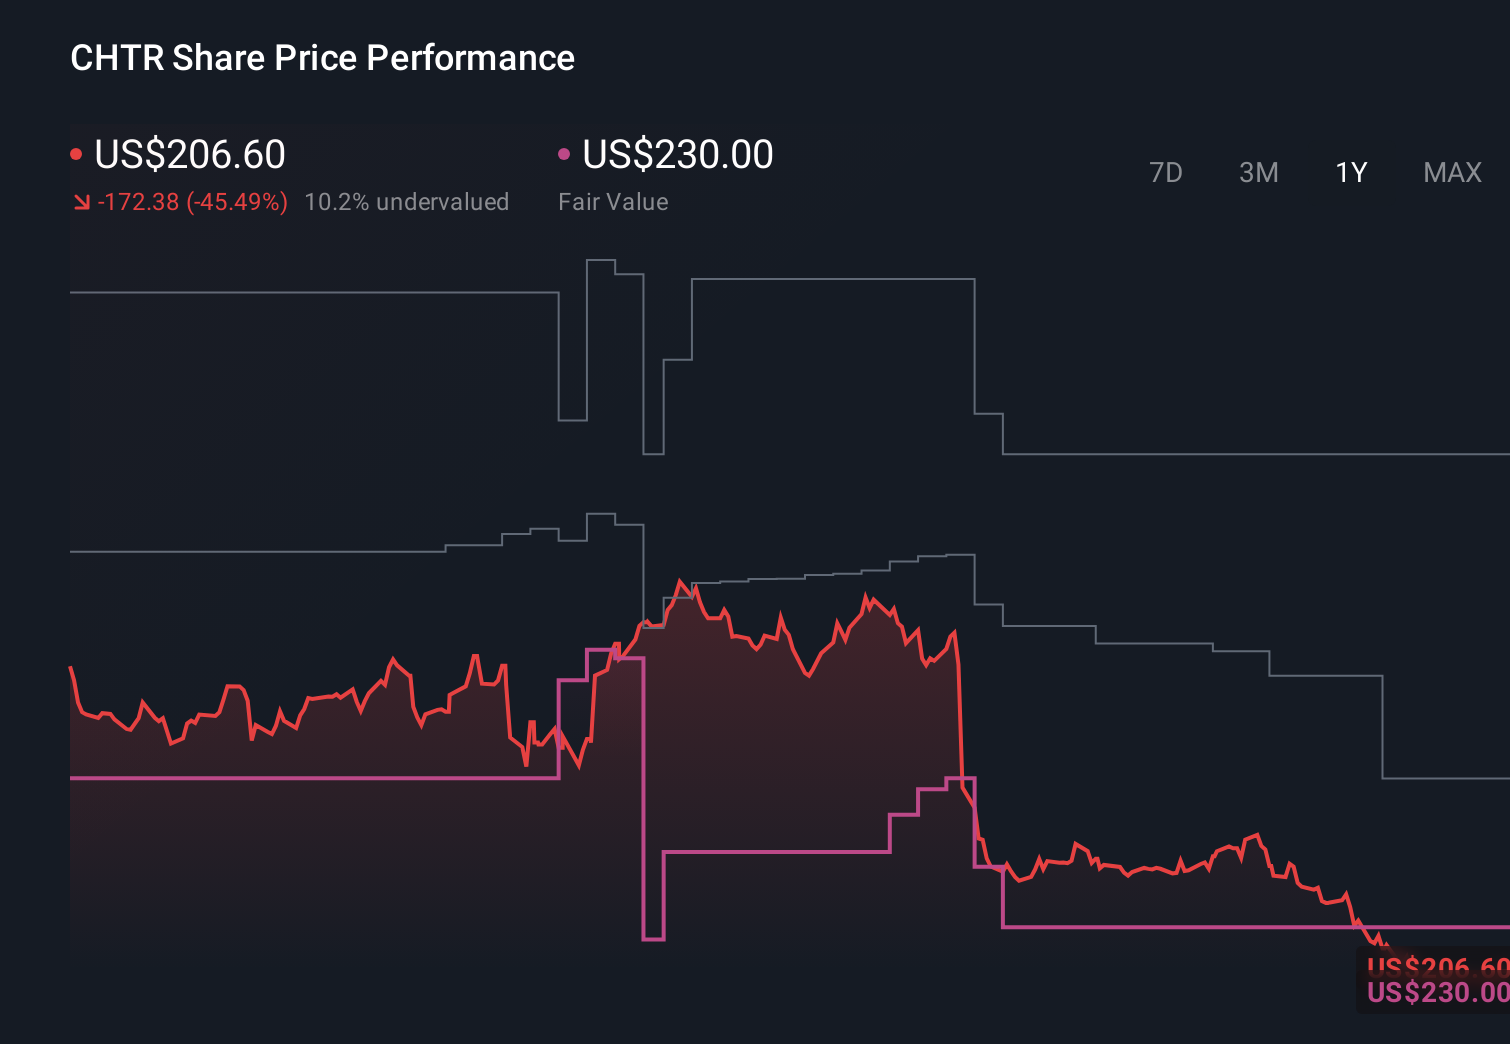
- Despite a rough longer term track record, with the stock down about 41.4% year to date and 44.1% over the last year, it has shown some short term life, gaining roughly 3.9% in the last week after a 6.9% slide over the past month.
- Recent moves have been driven less by a single headline and more by a mix of ongoing cord cutting worries, competitive pressure from fiber and fixed wireless, and regulatory scrutiny of broadband markets. At the same time, investors are reassessing infrastructure like Charter as a potential defensive play if the economy softens. This adds a layer of volatility when sentiment swings between pessimism on subscribers and optimism on cash flows.
- On our framework, Charter scores a 5 out of 6 on valuation checks, suggesting it screens as undervalued on most metrics. Next we will break down what those models are actually saying about the stock today, before circling back to an even more powerful way to think about valuation at the end of this piece.
Find out why Charter Communications's -44.1% return over the last year is lagging behind its peers.
Approach 1: Charter Communications Discounted Cash Flow (DCF) Analysis
A Discounted Cash Flow model estimates what a company is worth by projecting the cash it can generate in the future and then discounting those cash flows back to today in dollar terms. For Charter Communications, the 2 Stage Free Cash Flow to Equity model starts with last twelve months free cash flow of about $4.5 billion and then layers on analyst forecasts and longer term extrapolations from Simply Wall St.
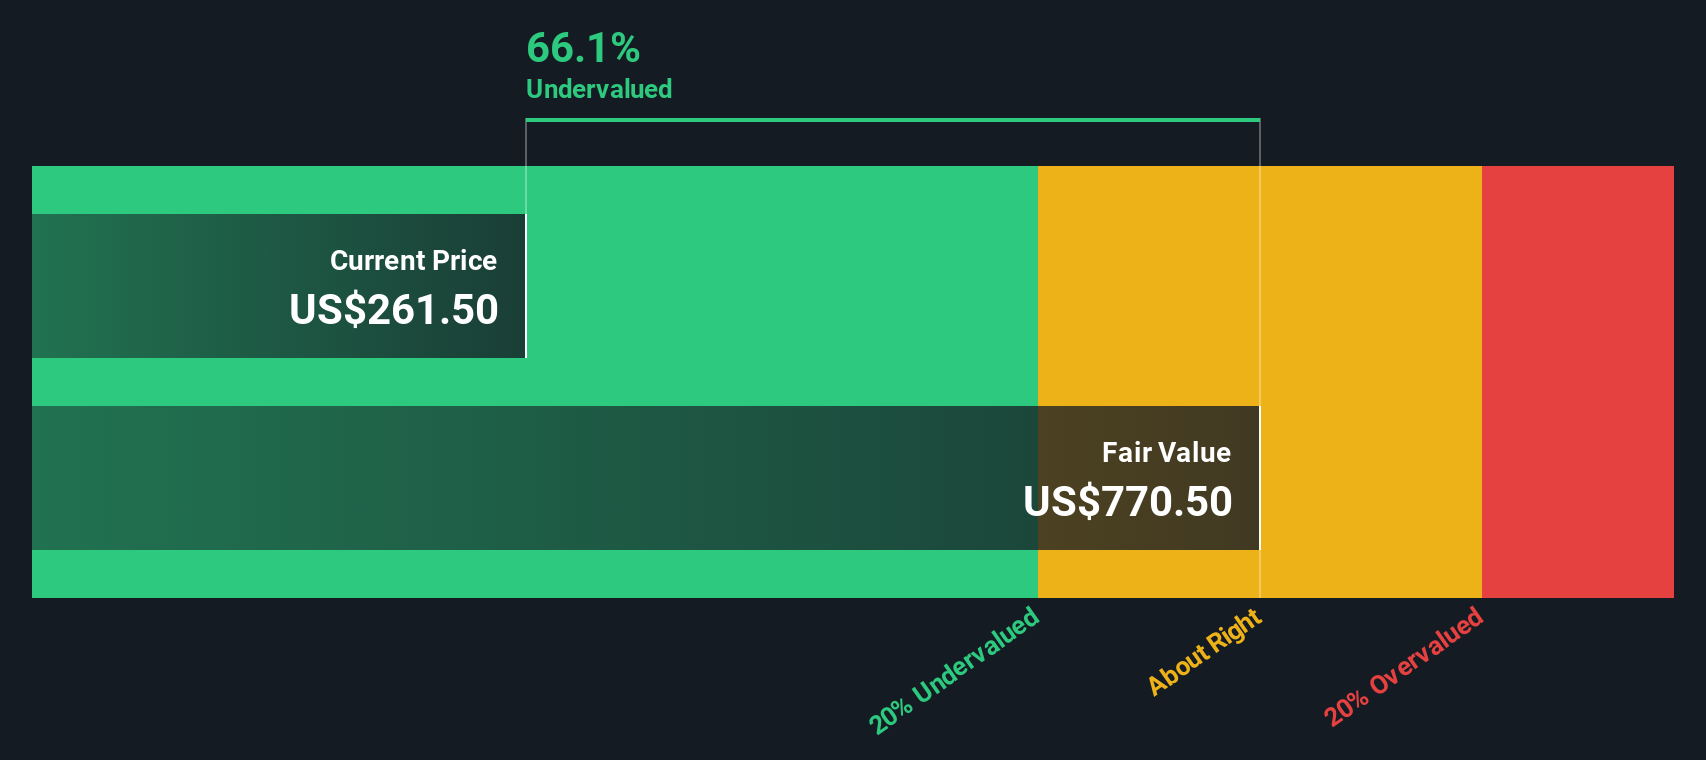
Analysts see free cash flow rising to around $9.2 billion by 2029, with further growth taking it above $14.8 billion by 2035. This implies a steady increase in Charter’s ability to generate cash for shareholders. When all of these projected cash flows are discounted back to the present, the model arrives at an estimated intrinsic value of roughly $834 per share.
With the stock trading near $204, the DCF suggests it is about 75.5% undervalued relative to this fair value estimate. This represents a very large gap that frames Charter as a deep value opportunity rather than a fully priced turnaround story.
Result: UNDERVALUED
Our Discounted Cash Flow (DCF) analysis suggests Charter Communications is undervalued by 75.5%. Track this in your watchlist or portfolio, or discover 906 more undervalued stocks based on cash flows.
Approach 2: Charter Communications Price vs Earnings
For a profitable business like Charter, the price to earnings ratio is a useful yardstick because it links what investors pay today directly to the company’s current earning power. In general, faster earnings growth and lower perceived risk justify a higher PE, while slower growth or greater uncertainty should translate into a lower multiple.
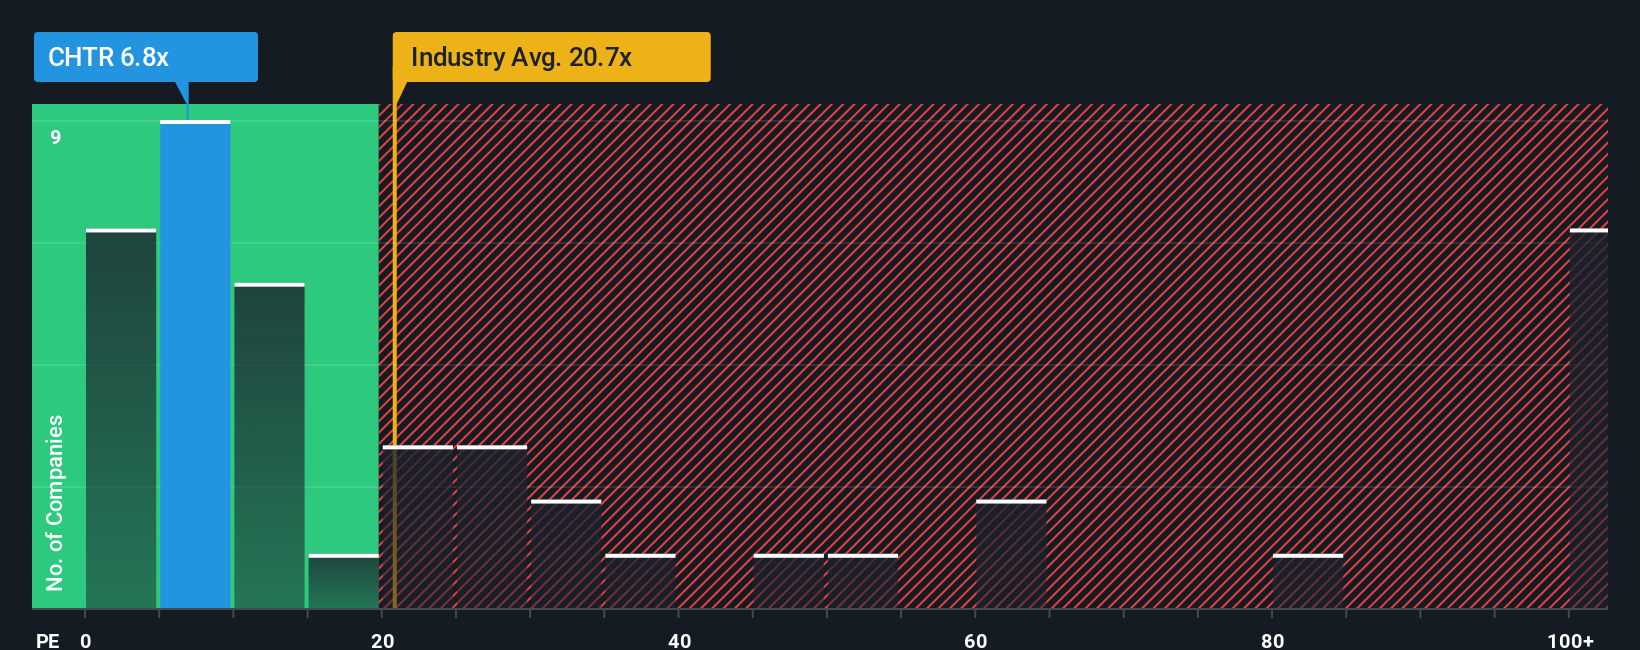
Charter currently trades on a PE of about 5.2x, which is significantly below both the broader media industry average of roughly 15.6x and a peer group average near 22.8x. On the surface, that gap suggests the market is heavily discounting Charter’s earnings, possibly due to concerns around subscriber trends and competitive pressure.
Simply Wall St’s Fair Ratio framework goes a step further than simple peer comparisons. It estimates what a “normal” PE should be for Charter, adjusting for its earnings growth outlook, profitability, risk profile, industry, and market cap. For Charter, the Fair Ratio is 19.4x, well above the current 5.2x multiple, indicating the market price may not be fully reflecting the company’s fundamentals.
Result: UNDERVALUED
PE ratios tell one story, but what if the real opportunity lies elsewhere? Discover 1450 companies where insiders are betting big on explosive growth.
Upgrade Your Decision Making: Choose your Charter Communications Narrative
Earlier we mentioned that there is an even better way to understand valuation. Let us introduce you to Narratives, a simple tool on Simply Wall St’s Community page that lets you attach a clear story to your numbers by linking your view of a company’s future revenue, earnings and margins to a financial forecast, a fair value, and ultimately a buy or sell decision by comparing that Fair Value with today’s Price. It stays dynamically updated when new earnings or news arrive. For Charter Communications, for example, one investor might build a bullish Narrative that assumes broadband stabilizes, DOCSIS 4.0 upgrades and Spectrum Mobile bundling support modest revenue growth and slightly higher margins, leading to a Fair Value closer to the upper end of current analyst targets around 500 dollars. Another more cautious investor might emphasize fiber competition, ACP risks and high leverage, assume flat revenue and only modest margin gains, and land on a Fair Value nearer the low end around 223 dollars. Both Narratives can be visible side by side so you can quickly see which story you believe and whether today’s roughly 204 dollar share price sits at an attractive discount or too close to your own estimate of fair value.
Do you think there's more to the story for Charter Communications? Head over to our Community to see what others are saying!
This article by Simply Wall St is general in nature. We provide commentary based on historical data and analyst forecasts only using an unbiased methodology and our articles are not intended to be financial advice. It does not constitute a recommendation to buy or sell any stock, and does not take account of your objectives, or your financial situation. We aim to bring you long-term focused analysis driven by fundamental data. Note that our analysis may not factor in the latest price-sensitive company announcements or qualitative material. Simply Wall St has no position in any stocks mentioned.
Have feedback on this article? Concerned about the content? Get in touch with us directly. Alternatively, email editorial-team@simplywallst.com