
 Nasdaq
 华尔街日报
华尔街日报Assessing Blue Owl Capital’s Valuation After a Volatile Year and Recent Fundraising Expansion
- Wondering if Blue Owl Capital is a bargain or a value trap at around $16 a share? You are not alone, and this is exactly the kind of stock where a closer look at valuation can really pay off.
- The share price has bounced about 6.6% over the last week and 3.8% over the past month, but that still sits against a much tougher backdrop with the stock down 32.1% year to date and 28.3% over the last year. Even so, the 3 year and 5 year returns are 59.3% and 86.7% respectively.
- Some of this recent volatility has been tied to shifting sentiment around alternative asset managers generally, as investors reassess how higher for longer interest rates and fundraising trends impact fee related earnings and growth pipelines. At the same time, Blue Owl Capital has been active on the corporate front, expanding its credit and GP stakes platforms through new fund launches and strategic capital commitments that aim to lock in more durable, long term fee streams.
- Despite those moves, Blue Owl currently scores just 0/6 on our valuation checks, which suggests the market may not see it as obviously undervalued on the standard metrics. Next, we will break down how different valuation approaches view the stock, and then circle back at the end to a more holistic way of thinking about what Blue Owl is really worth.
Blue Owl Capital scores just 0/6 on our valuation checks. See what other red flags we found in the full valuation breakdown.
Approach 1: Blue Owl Capital Excess Returns Analysis
The Excess Returns model looks at how much profit a company can generate above the return that investors demand on its equity, and then values the stock based on those surplus returns over time.
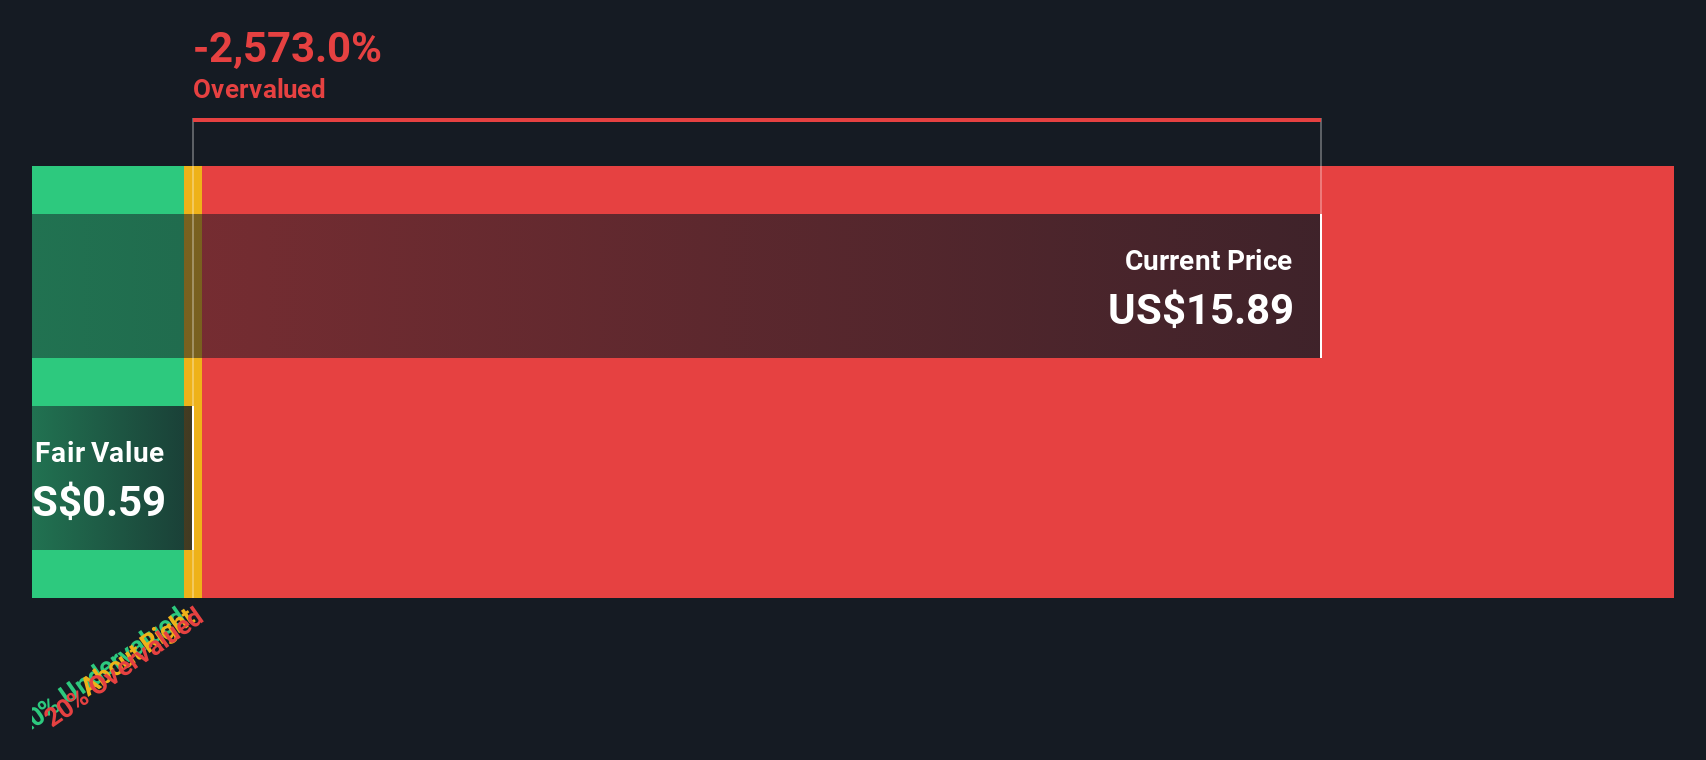
For Blue Owl Capital, the numbers are not especially favorable in this framework. The book value sits at $3.45 per share, with a stable earnings per share estimate of $0.14, based on the median return on equity over the past five years. Against a required cost of equity of $0.30 per share, this translates into an excess return of $-0.15 per share. This means the model assumes Blue Owl is not currently earning enough on its equity base to clear its cost of capital.
Even using a slightly higher stable book value of $3.50 per share, derived from the five year median, the implied intrinsic value from this Excess Returns analysis comes out far below the current share price. On this basis, the stock appears roughly 2859.0% overvalued. In other words, this approach suggests investors are paying a steep premium for future improvement that is not yet visible in the historical return profile.
Result: OVERVALUED
Our Excess Returns analysis suggests Blue Owl Capital may be overvalued by 2859.0%. Discover 906 undervalued stocks or create your own screener to find better value opportunities.
Approach 2: Blue Owl Capital Price vs Sales
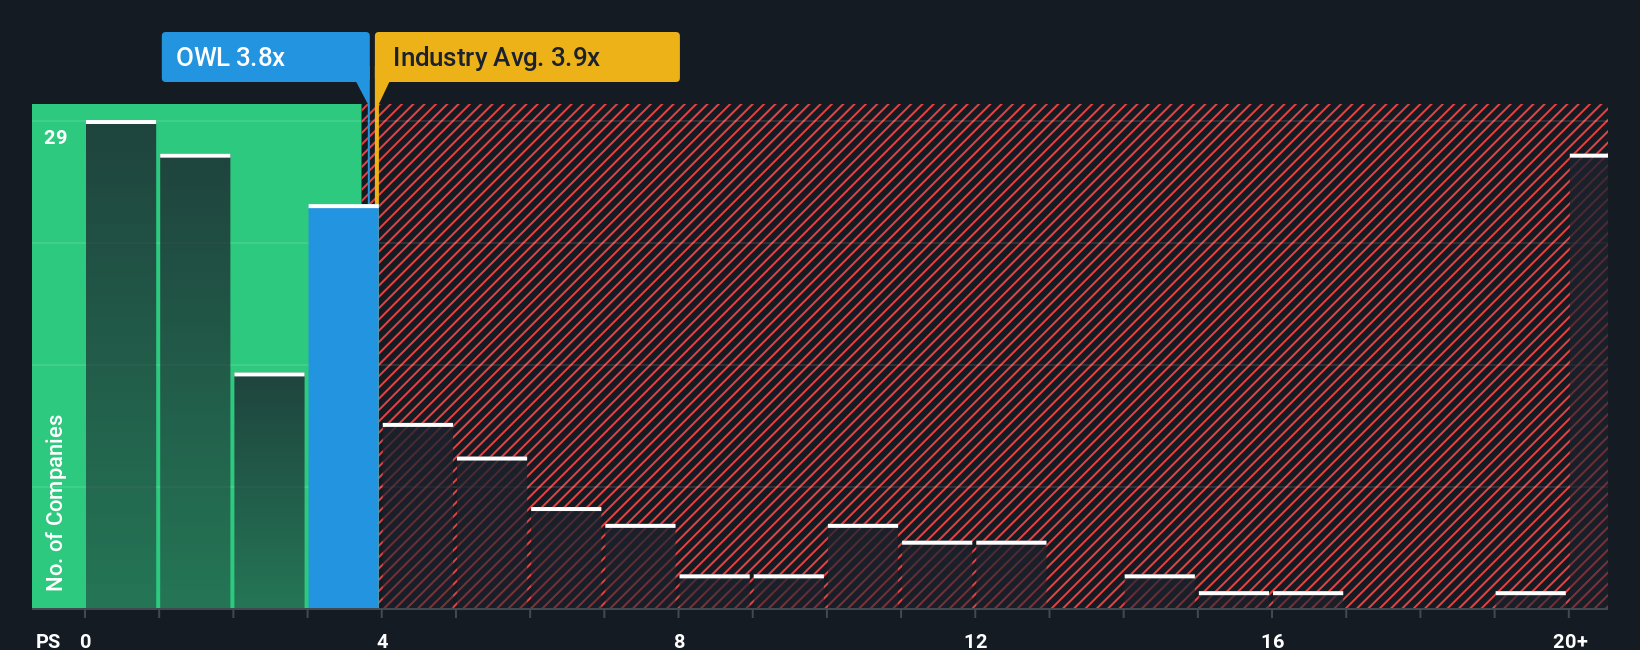
For profitable, fee driven businesses like Blue Owl Capital, the price to sales (P/S) ratio is a useful way to gauge how much investors are willing to pay for each dollar of revenue, especially when earnings can be influenced by non cash items and short term market swings. In general, higher growth and more predictable cash flows justify a higher normal or fair P/S multiple, while business or balance sheet risk tends to pull that fair range lower.
Blue Owl currently trades on a P/S ratio of 3.88x, which sits slightly above the Capital Markets industry average of 3.85x and the peer group average of 3.72x. Simply Wall St also calculates a proprietary Fair Ratio of 3.86x for Blue Owl, which reflects what investors might reasonably pay given its specific growth profile, risks, profit margins, market cap and industry positioning. This Fair Ratio is more tailored than a simple peer or sector comparison because it adjusts for the company’s own fundamentals rather than assuming all capital markets firms deserve the same multiple.
With Blue Owl’s actual P/S multiple of 3.88x sitting very close to the Fair Ratio of 3.86x, the shares look roughly in line with their fundamentals on this metric.
Result: ABOUT RIGHT
PS ratios tell one story, but what if the real opportunity lies elsewhere? Discover 1450 companies where insiders are betting big on explosive growth.
Upgrade Your Decision Making: Choose your Blue Owl Capital Narrative
Earlier we mentioned that there is an even better way to understand valuation, so let us introduce you to Narratives, a simple way to connect your view of Blue Owl Capital’s future with a clear financial forecast and a fair value estimate. A Narrative is the story you believe about a company, translated into numbers like future revenue, earnings and margins. Instead of just accepting a single target price, you can see exactly how your assumptions lead to a specific Fair Value. On Simply Wall St’s Community page, used by millions of investors, Narratives make this process easy and accessible by letting you compare your Fair Value to today’s share price to decide whether Blue Owl looks like a buy, hold or sell. They also update dynamically as new news, earnings or guidance arrives, so your view stays current without having to rebuild your analysis from scratch. For example, one investor’s optimistic Narrative for Blue Owl might assume strong data center driven growth and support a Fair Value around $29 per share, while a more cautious investor might focus on fundraising and integration risks and land closer to $21. Yet both can clearly see how their different stories translate into different price signals.
Do you think there's more to the story for Blue Owl Capital? Head over to our Community to see what others are saying!

This article by Simply Wall St is general in nature. We provide commentary based on historical data and analyst forecasts only using an unbiased methodology and our articles are not intended to be financial advice. It does not constitute a recommendation to buy or sell any stock, and does not take account of your objectives, or your financial situation. We aim to bring you long-term focused analysis driven by fundamental data. Note that our analysis may not factor in the latest price-sensitive company announcements or qualitative material. Simply Wall St has no position in any stocks mentioned.
Have feedback on this article? Concerned about the content? Get in touch with us directly. Alternatively, email editorial-team@simplywallst.com