
 Nasdaq
 华尔街日报
华尔街日报Is Barrick Gold Still Attractive After 141% Surge and DCF Upside in 2025?
How Barrick Mining Has Been Performing
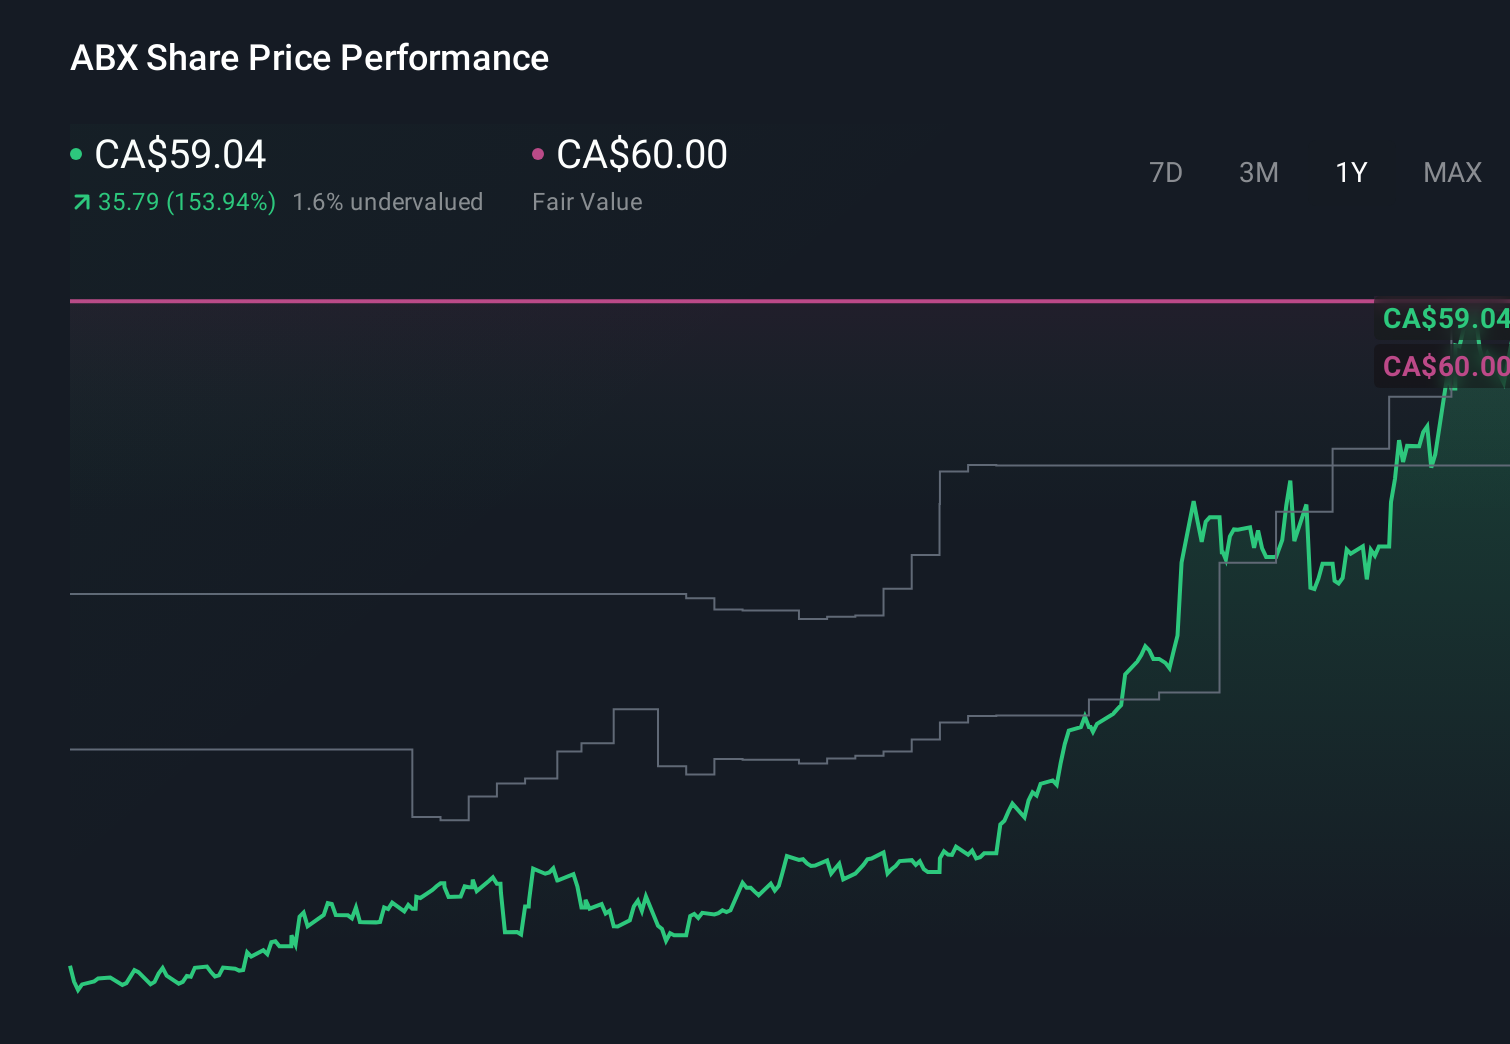
To understand whether Barrick Mining’s current share price is justified, it helps to first look at how the stock has actually performed for investors over different time frames. Recent returns paint a picture of a company that has been through some short term volatility but has rewarded patient shareholders over the longer term.
Over the last week, Barrick Mining’s share price has slipped by 6.4%, giving the impression that momentum might be cooling after a strong run. Step back to a 30 day view, and the stock is still up 19.5%, which suggests the latest pullback could be part of a normal consolidation rather than a complete change in trend.
Zooming out further, the share price has climbed 141.2% year to date and 132.6% over the last year, indicating that most of the value creation has come in a relatively recent window. On a multi year basis, returns of 159.6% over three years and 122.5% over five years show that long term holders have benefited from both cyclical tailwinds and company specific progress.
This mix of short term weakness and strong longer term gains raises a natural question: are we looking at a stock that has already priced in its best days, or one that is merely pausing before another leg higher? The next step is to compare Barrick Mining’s current market price to what different valuation models suggest it might be worth, and to see how those models line up with the company’s underlying fundamentals.
Approach 1: Barrick Mining Discounted Cash Flow (DCF) Analysis
The Discounted Cash Flow model estimates what a company is worth by projecting its future cash flows and then discounting those back to today, to reflect risk and the time value of money. For Barrick Mining, the 2 Stage Free Cash Flow to Equity model starts with last twelve month free cash flow of about $2.57 billion and then uses analyst forecasts for the next few years, with further cash flows extrapolated by Simply Wall St.
Under this approach, free cash flow is projected to rise to roughly $9.07 billion by 2029, with additional growth assumed over the following years. When these projected cash flows are discounted back to today, the model arrives at an intrinsic value of about $185.70 per share. Compared with the current share price, this implies the stock is trading at a 70.1% discount to its estimated fair value. This suggests very substantial upside if the cash flow path materialises.
Result: UNDERVALUED
Our Discounted Cash Flow (DCF) analysis suggests Barrick Mining is undervalued by 70.1%. Track this in your watchlist or portfolio, or discover 908 more undervalued stocks based on cash flows.
Approach 2: Barrick Mining Price vs Earnings
For profitable companies like Barrick Mining, the price to earnings (PE) ratio is a useful way to gauge whether investors are paying a reasonable price for each dollar of current earnings. A higher PE can be justified when a business is expected to grow faster or is seen as lower risk, while companies with slower growth or higher uncertainty usually deserve a lower, more conservative multiple.
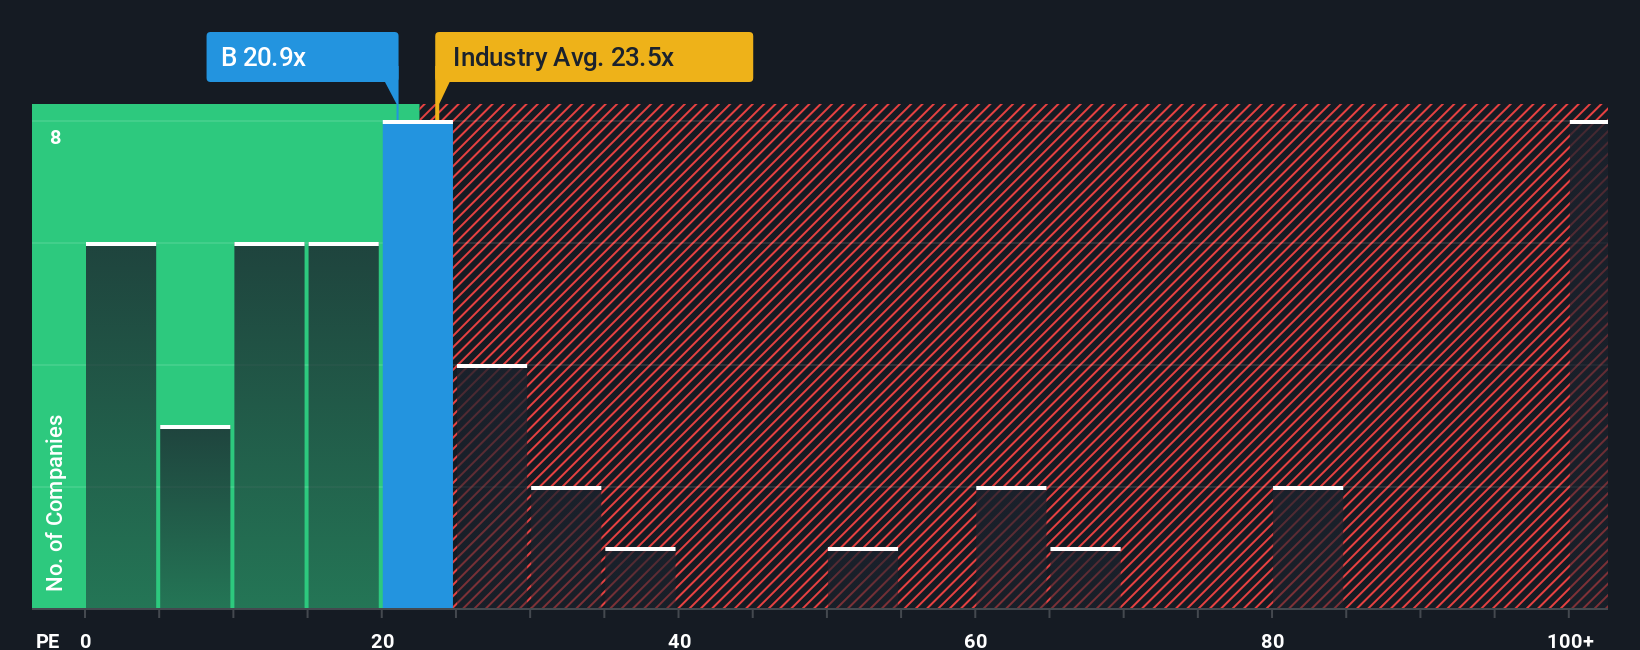
Barrick currently trades on a PE of about 18.9x. That sits below both the broader Metals and Mining industry average of roughly 21.1x and the peer group average near 33.8x, suggesting the market is valuing its earnings more cautiously than many competitors. To get beyond simple comparisons, Simply Wall St calculates a proprietary Fair Ratio, which in this case is around 24.2x for Barrick. This Fair Ratio reflects a view of what PE would be appropriate once factors like expected earnings growth, profit margins, company size, sector characteristics and stock specific risks are taken into account.
Because the Fair Ratio of 24.2x is notably higher than the current 18.9x multiple, Barrick’s shares appear undervalued on an earnings based view.
Result: UNDERVALUED
PE ratios tell one story, but what if the real opportunity lies elsewhere? Discover 1451 companies where insiders are betting big on explosive growth.
Upgrade Your Decision Making: Choose your Barrick Mining Narrative
Earlier we mentioned that there is an even better way to understand valuation, so let us introduce you to Narratives, a simple framework where you write the story behind your numbers by linking your view on Barrick Mining’s future revenue, earnings and margins to a financial forecast and a fair value estimate, then compare that fair value to today’s price to decide whether to buy, hold or sell.
On Simply Wall St’s Community page, millions of investors use Narratives as an easy, accessible tool that turns their perspective on a company into a living model which automatically updates when fresh information comes in, such as new earnings, guidance or major news.
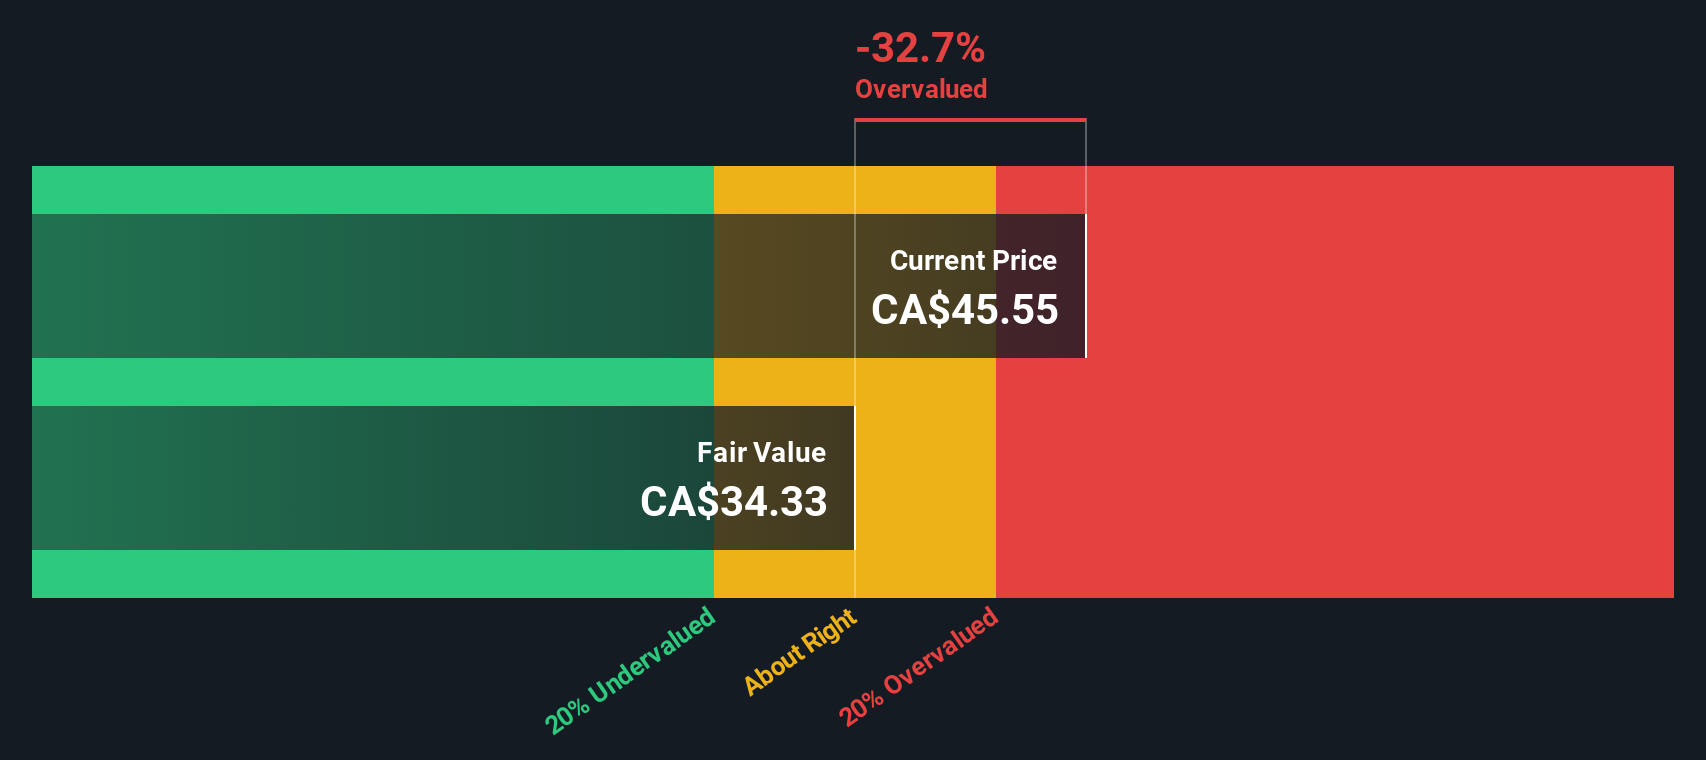
For Barrick Mining, one Narrative might say the stock is undervalued at around CA$48 because fair value is closer to CA$55 to CA$60 as gold’s safe haven role strengthens. A more cautious Narrative might anchor closer to the analyst consensus near CA$38 with a lower fair value around CA$31 to CA$32 if production risks, cost pressures or weaker long term demand weigh on cash flows.
Do you think there's more to the story for Barrick Mining? Head over to our Community to see what others are saying!
This article by Simply Wall St is general in nature. We provide commentary based on historical data and analyst forecasts only using an unbiased methodology and our articles are not intended to be financial advice. It does not constitute a recommendation to buy or sell any stock, and does not take account of your objectives, or your financial situation. We aim to bring you long-term focused analysis driven by fundamental data. Note that our analysis may not factor in the latest price-sensitive company announcements or qualitative material. Simply Wall St has no position in any stocks mentioned.
Have feedback on this article? Concerned about the content? Get in touch with us directly. Alternatively, email editorial-team@simplywallst.com