
 Nasdaq
 华尔街日报
华尔街日报Nippon Shinyaku (TSE:4516): Rethinking Valuation After Deramiocel’s Phase 3 Win and JPMorgan Upgrade
Nippon Shinyaku (TSE:4516) just caught investors’ attention after deramiocel cleared a key Phase 3 hurdle in Duchenne muscular dystrophy, prompting a JPMorgan upgrade that reframes the company’s long-term profit and pipeline story.
See our latest analysis for Nippon Shinyaku.
The deramiocel news has lit a fire under Nippon Shinyaku, with a 7 day share price return of 64.20 percent and a 30 day share price return of 82.37 percent, signalling rapidly building momentum despite a weaker 3 year total shareholder return of minus 18.08 percent.
If this kind of pharma inflection point interests you, it is a good moment to explore other potential movers among healthcare stocks and see what else fits your strategy.
Yet with Nippon Shinyaku already trading above JPMorgan’s new target and its valuation rapidly rerating on deramiocel optimism, investors now face a pivotal question: is this still an opportunity to add exposure, or is future growth already priced in?
Price-to-Earnings of 12.6x: Is it justified?
On a trailing price to earnings basis, Nippon Shinyaku trades at 12.6 times earnings, which points to a discount relative to both the wider Japanese market and its pharmaceutical peers despite the recent rally.
The price to earnings ratio compares a company’s share price with its net profit, and in pharmaceuticals it is a common shorthand for how much investors are willing to pay today for each unit of current earnings. For Nippon Shinyaku, the 12.6 times multiple suggests the market is not fully pricing in its profit base, even after factoring in near term excitement around deramiocel.
Relative to the Japanese pharmaceuticals industry average multiple of 15.3 times and a peer average of 13.6 times, Nippon Shinyaku’s lower ratio implies investors are still attaching a valuation discount to the stock. That gap is even more striking against our estimated fair price to earnings ratio of 14.8 times. This is a level the market could gravitate toward if sentiment continues to improve and execution on the pipeline remains on track.
Explore the SWS fair ratio for Nippon Shinyaku
Result: Price-to-Earnings of 12.6x (UNDERVALUED).
However, investors should weigh clinical or regulatory setbacks for deramiocel, as well as any prolonged earnings pressure from declining net income, as potential brakes on the rerating.
Find out about the key risks to this Nippon Shinyaku narrative.
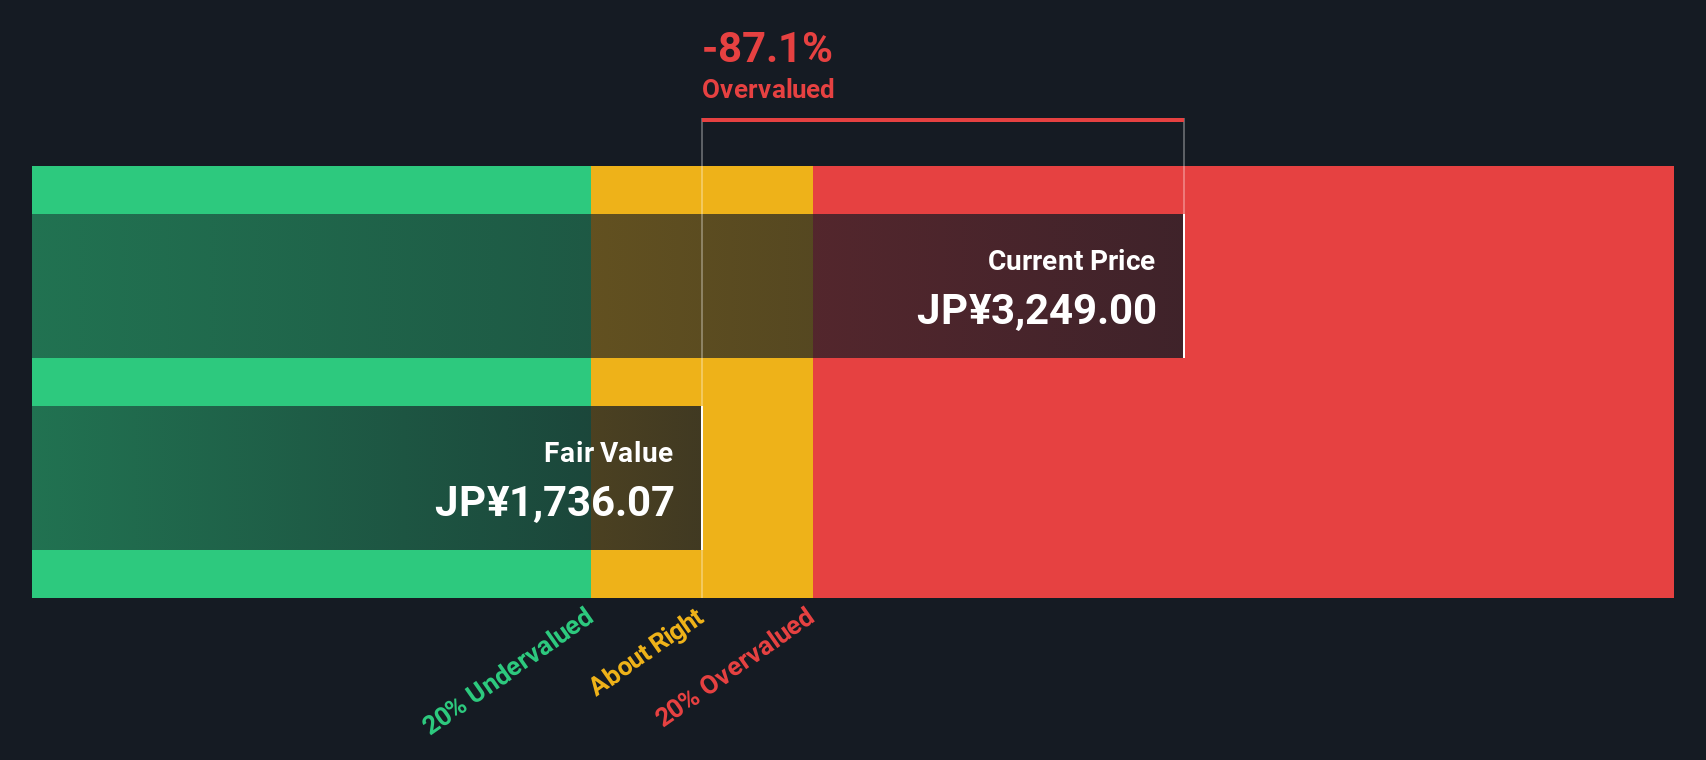
Another View: Our DCF Flags Overvaluation
While the earnings multiple hints at value, our DCF model paints a very different picture, with Nippon Shinyaku trading around ¥5,980 versus an estimated fair value of roughly ¥2,435. If cash flows do not ramp as hoped, today’s optimism could prove too expensive.
Look into how the SWS DCF model arrives at its fair value.
Simply Wall St performs a discounted cash flow (DCF) on every stock in the world every day (check out Nippon Shinyaku for example). We show the entire calculation in full. You can track the result in your watchlist or portfolio and be alerted when this changes, or use our stock screener to discover 909 undervalued stocks based on their cash flows. If you save a screener we even alert you when new companies match - so you never miss a potential opportunity.
Build Your Own Nippon Shinyaku Narrative
If you see the story differently or want to examine the numbers yourself, you can quickly build a personalised view in just minutes: Do it your way.
A great starting point for your Nippon Shinyaku research is our analysis highlighting 4 key rewards and 3 important warning signs that could impact your investment decision.
Looking for more investment ideas?
Before you move on, seize this moment to uncover fresh opportunities with the Simply Wall St Screener so your next high conviction idea does not pass you by.
- Capture potential mispricings by targeting companies trading below their intrinsic value with these 909 undervalued stocks based on cash flows. This can help you position yourself ahead of a possible market re rating.
- Ride structural themes in automation and data by screening for innovators at the frontier of intelligent technology through these 27 AI penny stocks.
- Explore the potential for steady income and capital growth by focusing on reliable payers using these 15 dividend stocks with yields > 3% before the broader market takes notice.
This article by Simply Wall St is general in nature. We provide commentary based on historical data and analyst forecasts only using an unbiased methodology and our articles are not intended to be financial advice. It does not constitute a recommendation to buy or sell any stock, and does not take account of your objectives, or your financial situation. We aim to bring you long-term focused analysis driven by fundamental data. Note that our analysis may not factor in the latest price-sensitive company announcements or qualitative material. Simply Wall St has no position in any stocks mentioned.
Have feedback on this article? Concerned about the content? Get in touch with us directly. Alternatively, email editorial-team@simplywallst.com