
 Nasdaq
 华尔街日报
华尔街日报In-Depth Analysis: Analog Devices Versus Competitors In Semiconductors & Semiconductor Equipment Industry
In the fast-paced and highly competitive business world of today, conducting thorough company analysis is essential for investors and industry observers. In this article, we will conduct an extensive industry comparison, evaluating Analog Devices (NASDAQ:ADI) in relation to its major competitors in the Semiconductors & Semiconductor Equipment industry. Through a detailed examination of key financial metrics, market standing, and growth prospects, our objective is to provide valuable insights and illuminate company's performance in the industry.
Analog Devices Background
Analog Devices Inc is an analog, mixed-signal, and digital-signal processing chipmaker. The firm is engaged in manufacturing converter chips, which are used to translate analog signals to digital and vice versa. The company serves tens of thousands of customers; more than half of its chip sales are to industrial and automotive end markets. ADI's chips are also incorporated into wireless infrastructure equipment.
| Company | P/E | P/B | P/S | ROE | EBITDA (in billions) | Gross Profit (in billions) | Revenue Growth |
|---|---|---|---|---|---|---|---|
| Analog Devices Inc | 61.21 | 4.04 | 12.58 | 2.32% | $1.47 | $1.94 | 25.91% |
| NVIDIA Corp | 45.93 | 37.93 | 24.37 | 29.14% | $38.75 | $41.85 | 62.49% |
| Broadcom Inc | 102.85 | 25.85 | 32.38 | 5.8% | $8.29 | $10.7 | 22.03% |
| Taiwan Semiconductor Manufacturing Co Ltd | 31.27 | 9.83 | 13.53 | 9.44% | $691.11 | $588.54 | 30.31% |
| Advanced Micro Devices Inc | 115.76 | 5.92 | 11.27 | 2.06% | $2.11 | $4.78 | 35.59% |
| Micron Technology Inc | 32.53 | 5.13 | 7.43 | 6.1% | $5.9 | $5.05 | 46.0% |
| Intel Corp | 671.67 | 1.81 | 3.32 | 3.98% | $7.85 | $5.22 | 2.78% |
| Qualcomm Inc | 34.99 | 8.85 | 4.37 | -12.88% | $3.51 | $6.24 | 10.03% |
| Texas Instruments Inc | 32.96 | 9.89 | 9.59 | 8.21% | $2.24 | $2.72 | 14.24% |
| ARM Holdings PLC | 179.21 | 20.02 | 33.77 | 3.3% | $0.22 | $1.11 | 34.48% |
| Marvell Technology Inc | 32.39 | 5.55 | 10.26 | 13.84% | $2.58 | $1.07 | 36.83% |
| NXP Semiconductors NV | 28.31 | 5.74 | 4.85 | 6.43% | $1.11 | $1.79 | -2.37% |
| Monolithic Power Systems Inc | 25.23 | 13.21 | 17.80 | 5.12% | $0.21 | $0.41 | 18.88% |
| ASE Technology Holding Co Ltd | 31.88 | 3.40 | 1.73 | 3.56% | $32.4 | $28.88 | 5.29% |
| Credo Technology Group Holding Ltd | 154.26 | 25.13 | 42.93 | 7.99% | $0.09 | $0.18 | 272.08% |
| First Solar Inc | 19.64 | 3.05 | 5.45 | 5.19% | $0.61 | $0.61 | 79.67% |
| ON Semiconductor Corp | 77.23 | 2.87 | 3.81 | 3.22% | $0.44 | $0.59 | -11.98% |
| STMicroelectronics NV | 44.62 | 1.29 | 2.04 | 1.33% | $0.31 | $1.06 | -1.97% |
| United Microelectronics Corp | 14.95 | 1.76 | 2.65 | 4.29% | $30.07 | $17.62 | -2.25% |
| Tower Semiconductor Ltd | 68.39 | 4.66 | 8.86 | 1.9% | $0.13 | $0.09 | 6.79% |
| Rambus Inc | 49.56 | 8.69 | 16.68 | 3.84% | $0.08 | $0.14 | 22.68% |
| Lattice Semiconductor Corp | 385.95 | 14.95 | 21.55 | 0.4% | $0.01 | $0.09 | 4.92% |
| Average | 103.79 | 10.26 | 13.27 | 5.35% | $39.43 | $34.23 | 32.69% |
By carefully studying Analog Devices, we can deduce the following trends:
The stock's Price to Earnings ratio of 61.21 is lower than the industry average by 0.59x, suggesting potential value in the eyes of market participants.
The current Price to Book ratio of 4.04, which is 0.39x the industry average, is substantially lower than the industry average, indicating potential undervaluation.
The Price to Sales ratio is 12.58, which is 0.95x the industry average. This suggests a possible undervaluation based on sales performance.
With a Return on Equity (ROE) of 2.32% that is 3.03% below the industry average, it appears that the company exhibits potential inefficiency in utilizing equity to generate profits.
With lower Earnings Before Interest, Taxes, Depreciation, and Amortization (EBITDA) of $1.47 Billion, which is 0.04x below the industry average, the company may face lower profitability or financial challenges.
Compared to its industry, the company has lower gross profit of $1.94 Billion, which indicates 0.06x below the industry average, potentially indicating lower revenue after accounting for production costs.
The company's revenue growth of 25.91% is significantly lower compared to the industry average of 32.69%. This indicates a potential fall in the company's sales performance.
Debt To Equity Ratio
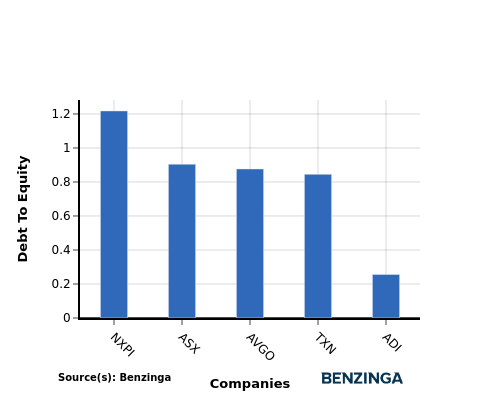
The debt-to-equity (D/E) ratio is a financial metric that helps determine the level of financial risk associated with a company's capital structure.
Considering the debt-to-equity ratio in industry comparisons allows for a concise evaluation of a company's financial health and risk profile, aiding in informed decision-making.
When assessing Analog Devices against its top 4 peers using the Debt-to-Equity ratio, the following comparisons can be made:
Analog Devices has a stronger financial position compared to its top 4 peers, as evidenced by its lower debt-to-equity ratio of 0.26.
This suggests that the company has a more favorable balance between debt and equity, which can be perceived as a positive indicator by investors.
Key Takeaways
For Analog Devices, the PE, PB, and PS ratios are all low compared to industry peers, indicating potential undervaluation. However, the low ROE, EBITDA, gross profit, and revenue growth suggest weaker financial performance relative to competitors in the Semiconductors & Semiconductor Equipment sector. This may reflect challenges in generating profits and sustaining growth for Analog Devices within the industry.
This article was generated by Benzinga's automated content engine and reviewed by an editor.