
 Nasdaq
 华尔街日报
华尔街日报Has the 41.9% Slide in LyondellBasell Shares in 2025 Gone Too Far?
- If you are wondering whether LyondellBasell Industries is starting to look like a bargain after a tough stretch, you are not alone. Let us unpack what the current price might really be telling us.
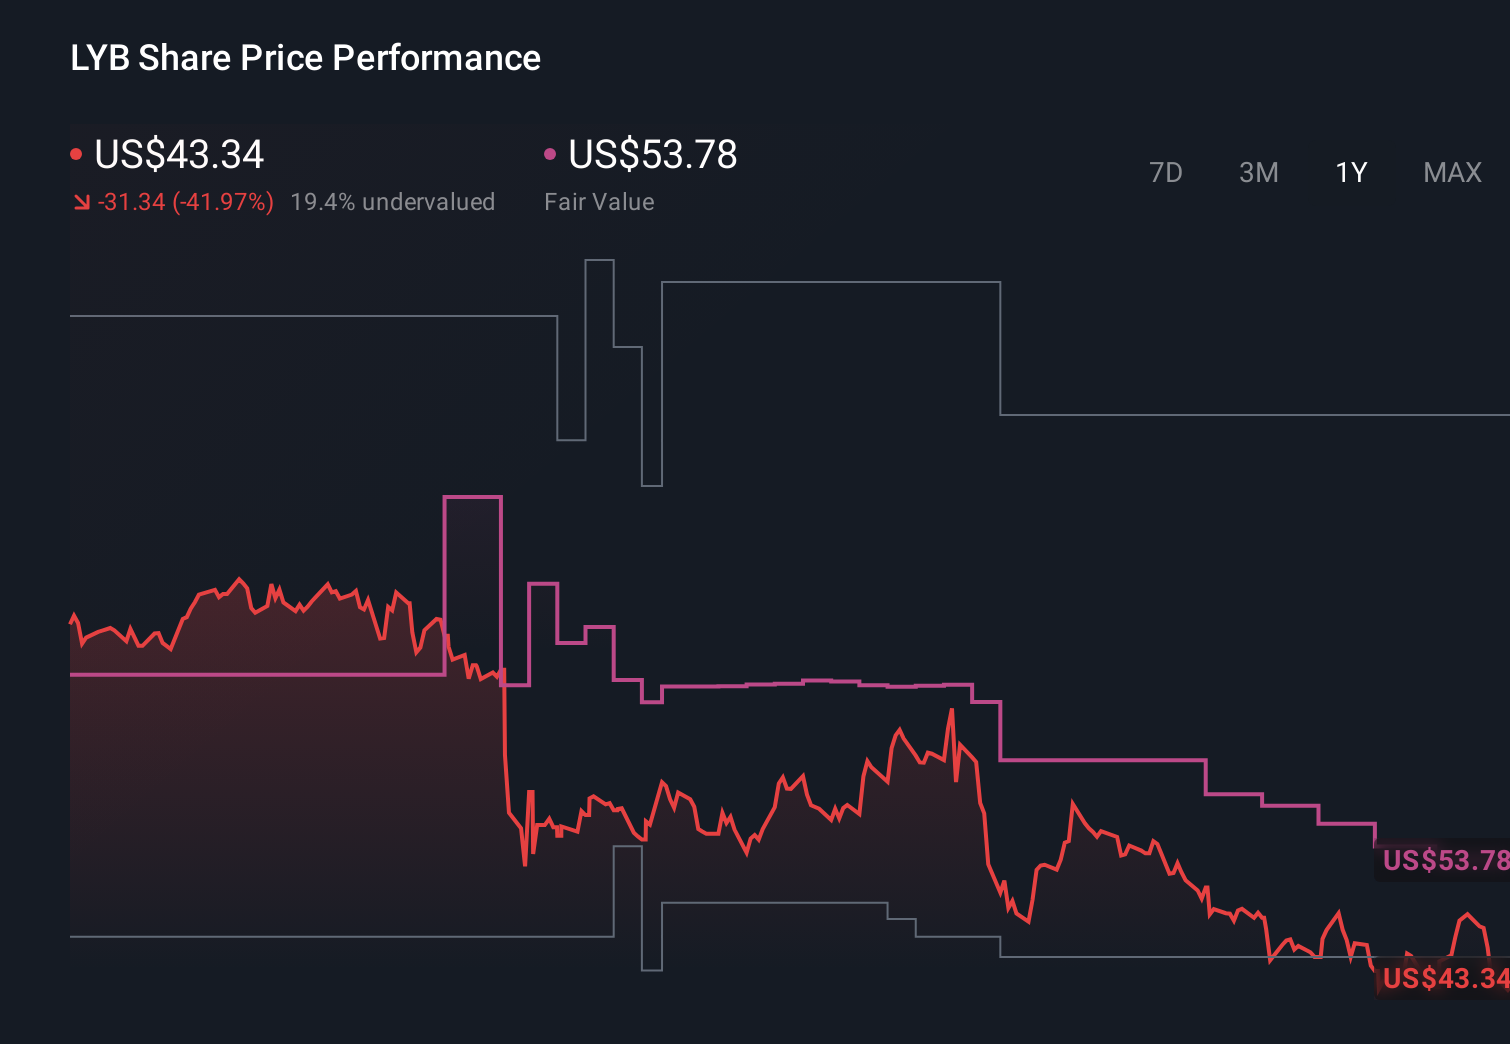
- The stock has slid about 11.8% over the last week and is down 41.9% year to date, which has pushed sentiment lower even as some investors are beginning to scout for a turnaround entry point.
- Recently, the market has been weighing softer demand signals across chemicals and plastics alongside ongoing geopolitical uncertainty, both of which tend to amplify swings in a cyclical name like LyondellBasell. At the same time, investors have been digesting updates around capital allocation, including debt reduction and shareholder returns, which can matter a lot when prices are this beaten down.
- Despite the slide, LyondellBasell scores a solid 5 out of 6 on our valuation checks, suggesting the stock screens as undervalued on most metrics we track. In the next sections we will walk through those valuation approaches, and then finish by looking at a way to tie them all together.
Approach 1: LyondellBasell Industries Discounted Cash Flow (DCF) Analysis
A Discounted Cash Flow model estimates what a business is worth today by projecting the cash it can generate in the future and then discounting those cash flows back to the present.
For LyondellBasell Industries, the latest twelve month Free Cash Flow sits at about $933.6 Million. Analysts and our model expect this figure to climb steadily, with projections reaching roughly $3.2 Billion in annual Free Cash Flow by 2035. Near term estimates, such as around $1.0 Billion in 2026 and $1.7 Billion in 2028, come from analyst forecasts, while the later years are extrapolated by Simply Wall St using a 2 Stage Free Cash Flow to Equity framework.
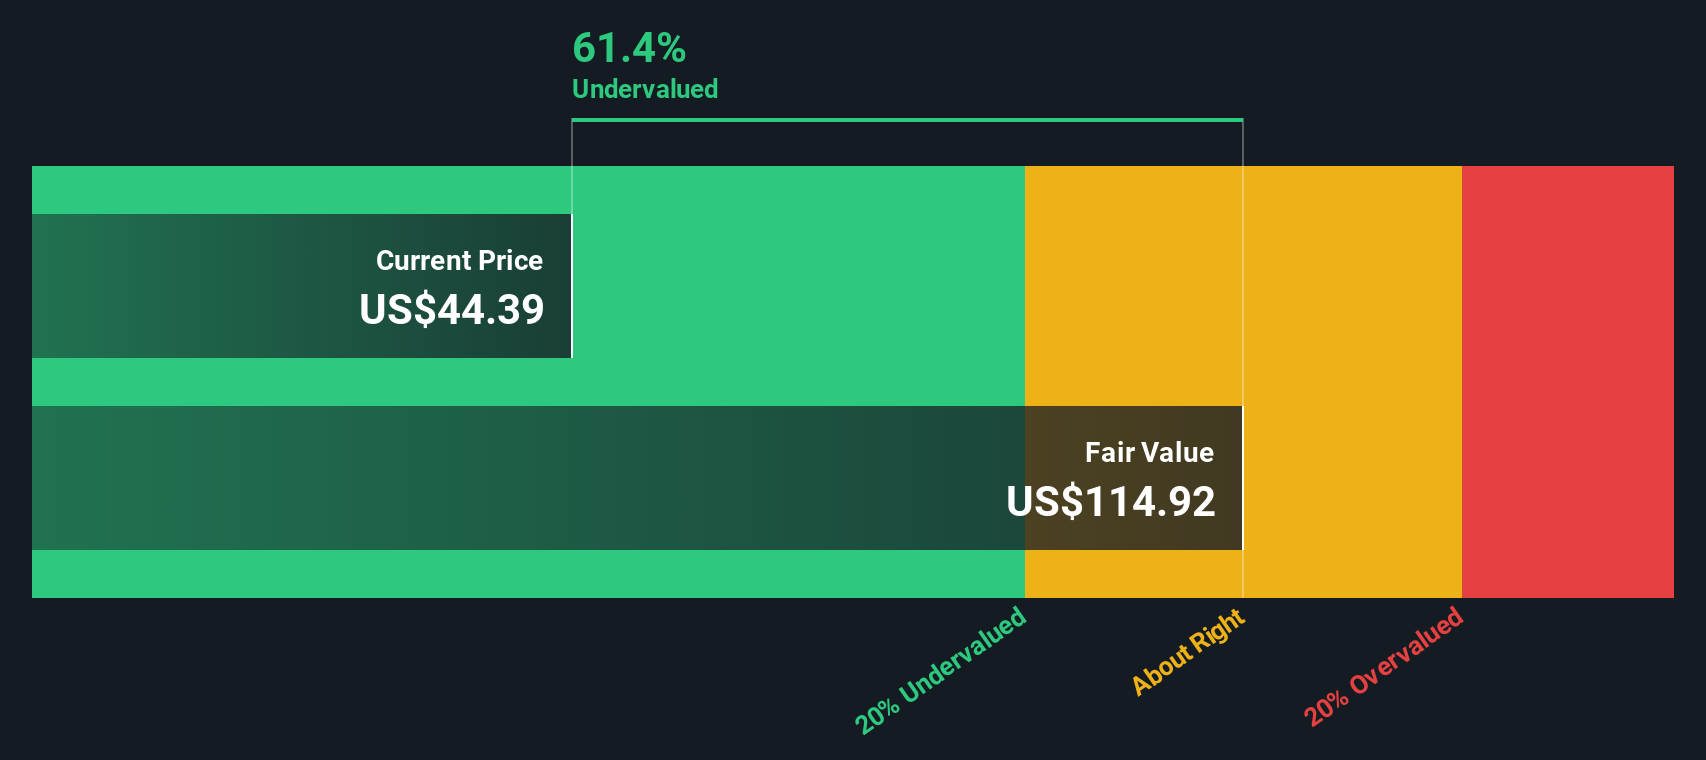
When all these projected cash flows are discounted back to today, the model arrives at an intrinsic value of roughly $113.49 per share. Compared with the current market price, this implies the stock is trading at about a 62.7% discount, indicating potential undervaluation on a cash flow basis.
Result: UNDERVALUED
Our Discounted Cash Flow (DCF) analysis suggests LyondellBasell Industries is undervalued by 62.7%. Track this in your watchlist or portfolio, or discover 909 more undervalued stocks based on cash flows.
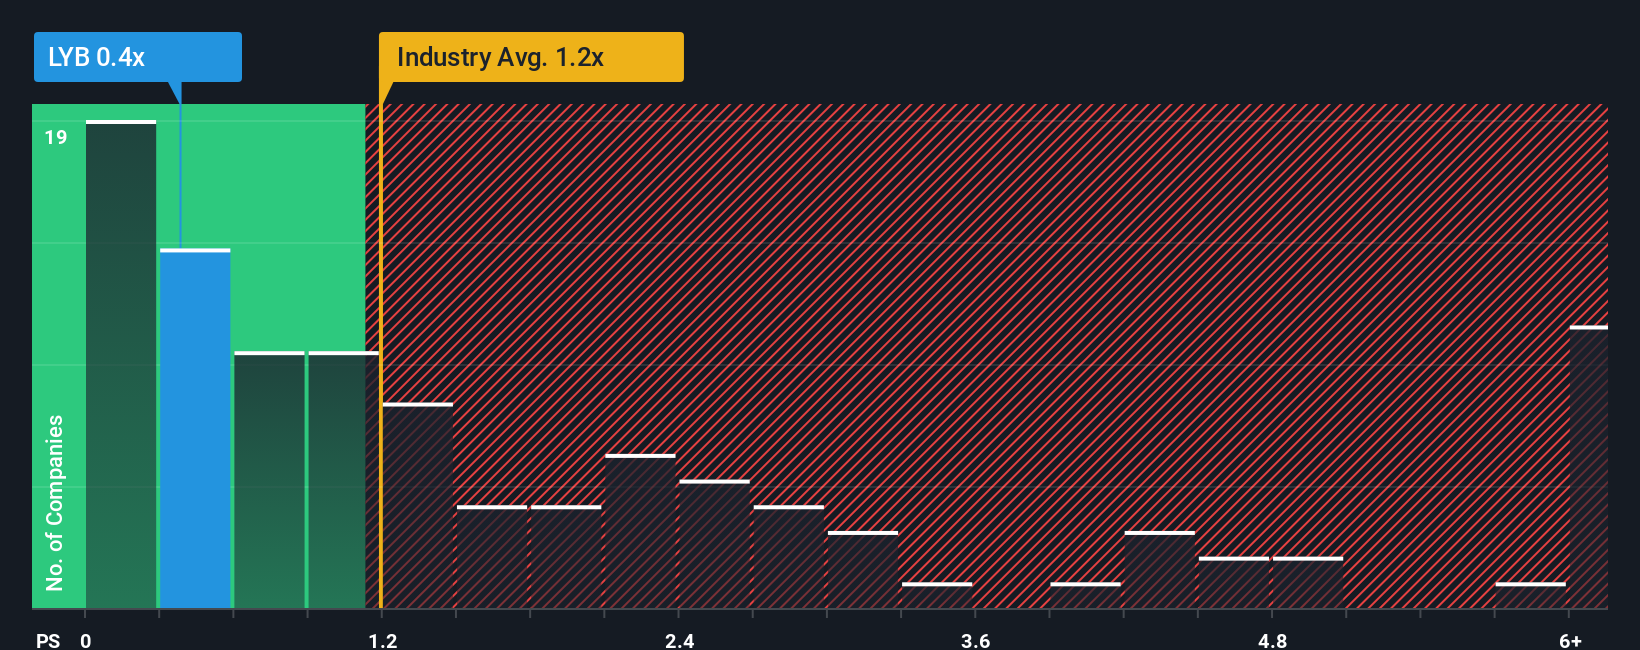
Approach 2: LyondellBasell Industries Price vs Sales
For cyclical, asset heavy businesses like LyondellBasell Industries, the Price to Sales ratio is often a more reliable yardstick than earnings based metrics, because revenues are typically less volatile than profits across the cycle. It also makes it easier to compare companies that may be at different points in their earnings recovery.
In general, investors are willing to pay a higher sales multiple for companies with stronger growth prospects and lower perceived risk, while slower growing or more volatile businesses tend to trade on lower ratios. That is why a “normal” or “fair” Price to Sales multiple varies from industry to industry and company to company.
LyondellBasell currently trades on a Price to Sales ratio of about 0.36x, which is well below both the Chemicals industry average of roughly 1.07x and the peer group average of around 0.60x. Simply Wall St’s proprietary Fair Ratio for LyondellBasell is 0.64x. This metric estimates what a reasonable Price to Sales multiple should be after adjusting for the company’s growth outlook, profitability, risk profile, industry positioning and market capitalization. This makes it more tailored than a simple comparison with peers or the broad industry.
With the actual 0.36x multiple sitting meaningfully below the 0.64x Fair Ratio, the shares appear undervalued on a sales based view.
Result: UNDERVALUED
PS ratios tell one story, but what if the real opportunity lies elsewhere? Discover 1452 companies where insiders are betting big on explosive growth.
Upgrade Your Decision Making: Choose your LyondellBasell Industries Narrative
Earlier we mentioned that there is an even better way to understand valuation, so let us introduce you to Narratives, which are simply your story about a company, linked directly to the numbers you think are realistic for its future revenue, earnings, margins and ultimately fair value.
On Simply Wall St’s Community page, Narratives give you an easy, guided way to connect what you believe about LyondellBasell’s strategy, risks and industry backdrop to an explicit financial forecast and a fair value estimate, and then compare that fair value with today’s price to decide whether it looks like a buy, hold or sell.
Because Narratives on the platform are updated as new information arrives, such as earnings results or news about catalyst demand and recycling investments, your view of LyondellBasell can evolve dynamically rather than staying anchored to an outdated thesis.
For example, one Narrative might lean toward the higher end of analyst expectations, assuming faster recovery in the Technology and catalyst segments and a fair value near the more optimistic targets around $90 per share. Another could reflect a more cautious stance that focuses on prolonged weak demand and uses assumptions closer to the lower targets near $44 per share. Seeing both side by side helps you decide which story you find more convincing.
Do you think there's more to the story for LyondellBasell Industries? Head over to our Community to see what others are saying!
This article by Simply Wall St is general in nature. We provide commentary based on historical data and analyst forecasts only using an unbiased methodology and our articles are not intended to be financial advice. It does not constitute a recommendation to buy or sell any stock, and does not take account of your objectives, or your financial situation. We aim to bring you long-term focused analysis driven by fundamental data. Note that our analysis may not factor in the latest price-sensitive company announcements or qualitative material. Simply Wall St has no position in any stocks mentioned.
Have feedback on this article? Concerned about the content? Get in touch with us directly. Alternatively, email editorial-team@simplywallst.com