
 Nasdaq
 华尔街日报
华尔街日报Is Prosegur Compañía de Seguridad, S.A. (BME:PSG) Expensive For A Reason? A Look At Its Intrinsic Value
Key Insights
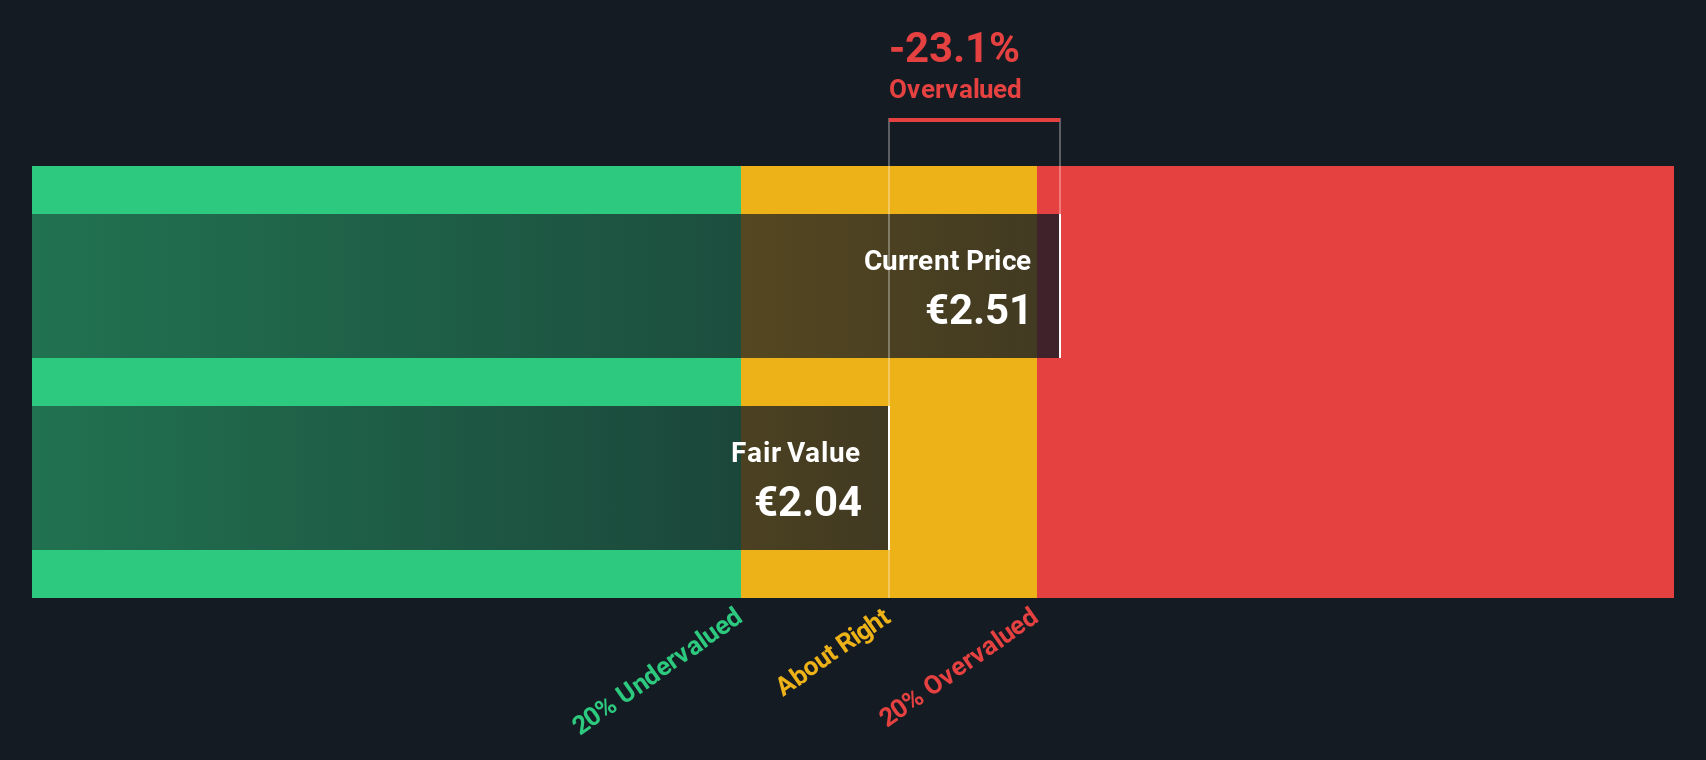
- Using the 2 Stage Free Cash Flow to Equity, Prosegur Compañía de Seguridad fair value estimate is €2.04
- Prosegur Compañía de Seguridad's €2.51 share price signals that it might be 23% overvalued
- The €3.18 analyst price target for PSG is 56% more than our estimate of fair value
Today we will run through one way of estimating the intrinsic value of Prosegur Compañía de Seguridad, S.A. (BME:PSG) by projecting its future cash flows and then discounting them to today's value. We will use the Discounted Cash Flow (DCF) model on this occasion. Don't get put off by the jargon, the math behind it is actually quite straightforward.
We generally believe that a company's value is the present value of all of the cash it will generate in the future. However, a DCF is just one valuation metric among many, and it is not without flaws. Anyone interested in learning a bit more about intrinsic value should have a read of the Simply Wall St analysis model.
The Calculation
We use what is known as a 2-stage model, which simply means we have two different periods of growth rates for the company's cash flows. Generally the first stage is higher growth, and the second stage is a lower growth phase. To begin with, we have to get estimates of the next ten years of cash flows. Where possible we use analyst estimates, but when these aren't available we extrapolate the previous free cash flow (FCF) from the last estimate or reported value. We assume companies with shrinking free cash flow will slow their rate of shrinkage, and that companies with growing free cash flow will see their growth rate slow, over this period. We do this to reflect that growth tends to slow more in the early years than it does in later years.
A DCF is all about the idea that a dollar in the future is less valuable than a dollar today, so we discount the value of these future cash flows to their estimated value in today's dollars:
10-year free cash flow (FCF) forecast
| 2026 | 2027 | 2028 | 2029 | 2030 | 2031 | 2032 | 2033 | 2034 | 2035 | |
| Levered FCF (€, Millions) | €140.5m | €167.6m | €117.0m | €111.0m | €107.9m | €106.5m | €106.3m | €106.9m | €108.2m | €109.8m |
| Growth Rate Estimate Source | Analyst x5 | Analyst x5 | Analyst x1 | Est @ -5.09% | Est @ -2.85% | Est @ -1.28% | Est @ -0.18% | Est @ 0.59% | Est @ 1.13% | Est @ 1.51% |
| Present Value (€, Millions) Discounted @ 12% | €126 | €134 | €83.6 | €71.0 | €61.6 | €54.4 | €48.6 | €43.7 | €39.5 | €35.8 |
("Est" = FCF growth rate estimated by Simply Wall St)
Present Value of 10-year Cash Flow (PVCF) = €698m
The second stage is also known as Terminal Value, this is the business's cash flow after the first stage. The Gordon Growth formula is used to calculate Terminal Value at a future annual growth rate equal to the 5-year average of the 10-year government bond yield of 2.4%. We discount the terminal cash flows to today's value at a cost of equity of 12%.
Terminal Value (TV)= FCF2035 × (1 + g) ÷ (r – g) = €110m× (1 + 2.4%) ÷ (12%– 2.4%) = €1.2b
Present Value of Terminal Value (PVTV)= TV / (1 + r)10= €1.2b÷ ( 1 + 12%)10= €388m
The total value is the sum of cash flows for the next ten years plus the discounted terminal value, which results in the Total Equity Value, which in this case is €1.1b. To get the intrinsic value per share, we divide this by the total number of shares outstanding. Relative to the current share price of €2.5, the company appears slightly overvalued at the time of writing. Remember though, that this is just an approximate valuation, and like any complex formula - garbage in, garbage out.
The Assumptions
Now the most important inputs to a discounted cash flow are the discount rate, and of course, the actual cash flows. If you don't agree with these result, have a go at the calculation yourself and play with the assumptions. The DCF also does not consider the possible cyclicality of an industry, or a company's future capital requirements, so it does not give a full picture of a company's potential performance. Given that we are looking at Prosegur Compañía de Seguridad as potential shareholders, the cost of equity is used as the discount rate, rather than the cost of capital (or weighted average cost of capital, WACC) which accounts for debt. In this calculation we've used 12%, which is based on a levered beta of 1.439. Beta is a measure of a stock's volatility, compared to the market as a whole. We get our beta from the industry average beta of globally comparable companies, with an imposed limit between 0.8 and 2.0, which is a reasonable range for a stable business.
See our latest analysis for Prosegur Compañía de Seguridad
SWOT Analysis for Prosegur Compañía de Seguridad
- Earnings growth over the past year exceeded the industry.
- Debt is well covered by earnings.
- Dividend is in the top 25% of dividend payers in the market.
- No major weaknesses identified for PSG.
- Annual earnings are forecast to grow faster than the Spanish market.
- Good value based on P/E ratio compared to estimated Fair P/E ratio.
- Debt is not well covered by operating cash flow.
- Dividends are not covered by earnings.
- Revenue is forecast to grow slower than 20% per year.
Moving On:
Whilst important, the DCF calculation ideally won't be the sole piece of analysis you scrutinize for a company. It's not possible to obtain a foolproof valuation with a DCF model. Preferably you'd apply different cases and assumptions and see how they would impact the company's valuation. For instance, if the terminal value growth rate is adjusted slightly, it can dramatically alter the overall result. What is the reason for the share price exceeding the intrinsic value? For Prosegur Compañía de Seguridad, there are three additional aspects you should further examine:
- Risks: Every company has them, and we've spotted 2 warning signs for Prosegur Compañía de Seguridad (of which 1 is a bit unpleasant!) you should know about.
- Future Earnings: How does PSG's growth rate compare to its peers and the wider market? Dig deeper into the analyst consensus number for the upcoming years by interacting with our free analyst growth expectation chart.
- Other High Quality Alternatives: Do you like a good all-rounder? Explore our interactive list of high quality stocks to get an idea of what else is out there you may be missing!
PS. Simply Wall St updates its DCF calculation for every Spanish stock every day, so if you want to find the intrinsic value of any other stock just search here.
Have feedback on this article? Concerned about the content? Get in touch with us directly. Alternatively, email editorial-team (at) simplywallst.com.
This article by Simply Wall St is general in nature. We provide commentary based on historical data and analyst forecasts only using an unbiased methodology and our articles are not intended to be financial advice. It does not constitute a recommendation to buy or sell any stock, and does not take account of your objectives, or your financial situation. We aim to bring you long-term focused analysis driven by fundamental data. Note that our analysis may not factor in the latest price-sensitive company announcements or qualitative material. Simply Wall St has no position in any stocks mentioned.