
 Nasdaq
 华尔街日报
华尔街日报Virco Mfg (VIRC) Q3 Loss and Margin Compression Reinforce Concerns Over Premium Valuation
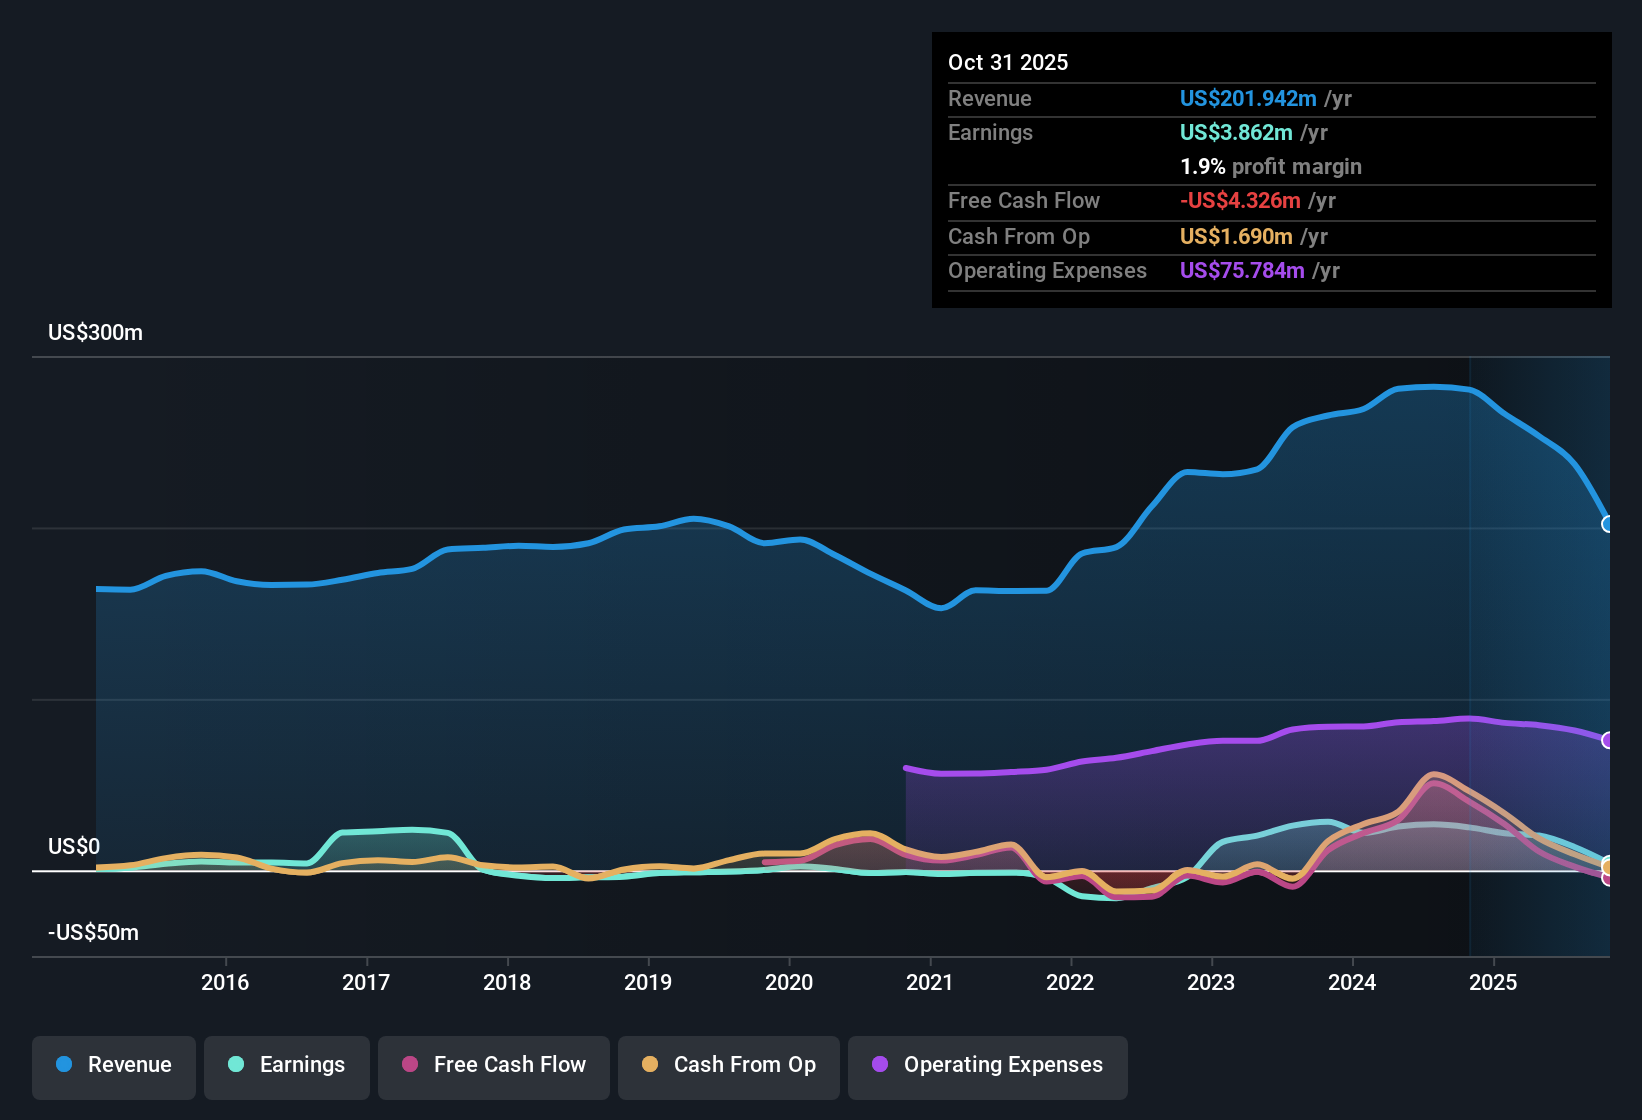
Virco Mfg (VIRC) just turned in a softer Q3 2026, with revenue of about $47.6 million and a basic EPS loss of roughly $0.08, even as its trailing twelve month revenue held at around $201.9 million alongside EPS of about $0.24. Over the past several quarters the company has seen quarterly revenue swing from $108.4 million in Q2 2025 to $92.1 million in Q2 2026 and $47.6 million in the latest quarter, while EPS has moved from a high of $1.04 to $0.65 before slipping into the red. This sets up a results season where investors will be paying close attention to how sustainable the current margin profile really is.
See our full analysis for Virco Mfg.With the latest numbers on the table, the next step is to see how they line up with the dominant narratives around Virco Mfg, and where the data starts to challenge the prevailing storyline.
Curious how numbers become stories that shape markets? Explore Community Narratives
Margins Slip as Net Profit Falls to 1.9%
- Trailing 12 month net profit margin is 1.9%, down from 8.9% a year earlier, while trailing net income dropped from about $26.8 million to $3.9 million over that span.
- Critics highlight that this margin squeeze weakens the bearish focus on one bad period, because
- over the past five years Virco still delivered reported earnings growth of 44.6% per year, moving from losses to profitability even after the recent slowdown.
- the latest Q3 2026 net loss of about $1.3 million comes after several profitable quarters, so the trailing 1.9% margin reflects both the setback and the earlier strength.
Premium Valuation at 28.2x P/E
- Virco trades on a price to earnings multiple of 28.2 times, versus about 16.5 times for peers and 23.1 times for the broader US Commercial Services industry. The $6.91 share price is also above the DCF fair value of roughly $6.34.
- What is striking for the bearish side is that this valuation stretch rests on earnings that recently softened, because
- trailing 12 month EPS slid from about $1.64 to $0.24 while the market price remained at $6.91, which mechanically pushes the P/E higher than both peers and the industry.
- the gap between the share price and the DCF fair value is not huge in absolute terms, but it still points to limited room for disappointment if margins stay near the current 1.9% level.
Five Year EPS Growth vs Recent Setback
- On a longer look, trailing 12 month EPS of about $0.24 follows a period where EPS was roughly $1.64 a year earlier and grew at about 44.6% per year over five years as the company shifted into sustained profitability.
- Bulls argue that this track record still matters for the story, and the recent pullback needs to be weighed against
- the fact that Virco has already demonstrated it can generate much higher trailing revenue, up to about $282 million, and stronger net income around $26.8 million when conditions are more favorable.
- the Q2 2026 result of roughly $92.1 million in revenue and $10.2 million in net income, which shows that the current Q3 dip sits within a wider pattern of historically higher profitability rather than years of weak performance.
Next Steps
Don't just look at this quarter; the real story is in the long-term trend. We've done an in-depth analysis on Virco Mfg's growth and its valuation to see if today's price is a bargain. Add the company to your watchlist or portfolio now so you don't miss the next big move.
See What Else Is Out There
Virco Mfg now carries thinner margins, a premium valuation and recently volatile earnings, which together leave little room for further operational missteps.
If this mix of shrinking profitability and stretched pricing feels uncomfortable, use our these 903 undervalued stocks based on cash flows to quickly focus on companies where current market prices better reflect resilient earnings power.
This article by Simply Wall St is general in nature. We provide commentary based on historical data and analyst forecasts only using an unbiased methodology and our articles are not intended to be financial advice. It does not constitute a recommendation to buy or sell any stock, and does not take account of your objectives, or your financial situation. We aim to bring you long-term focused analysis driven by fundamental data. Note that our analysis may not factor in the latest price-sensitive company announcements or qualitative material. Simply Wall St has no position in any stocks mentioned.
Have feedback on this article? Concerned about the content? Get in touch with us directly. Alternatively, email editorial-team@simplywallst.com