
 Nasdaq
 华尔街日报
华尔街日报Century Enka Limited's (NSE:CENTENKA) market cap dropped ₹1.1b last week; Individual investors bore the brunt
Key Insights
- Century Enka's significant individual investors ownership suggests that the key decisions are influenced by shareholders from the larger public
- A total of 14 investors have a majority stake in the company with 50% ownership
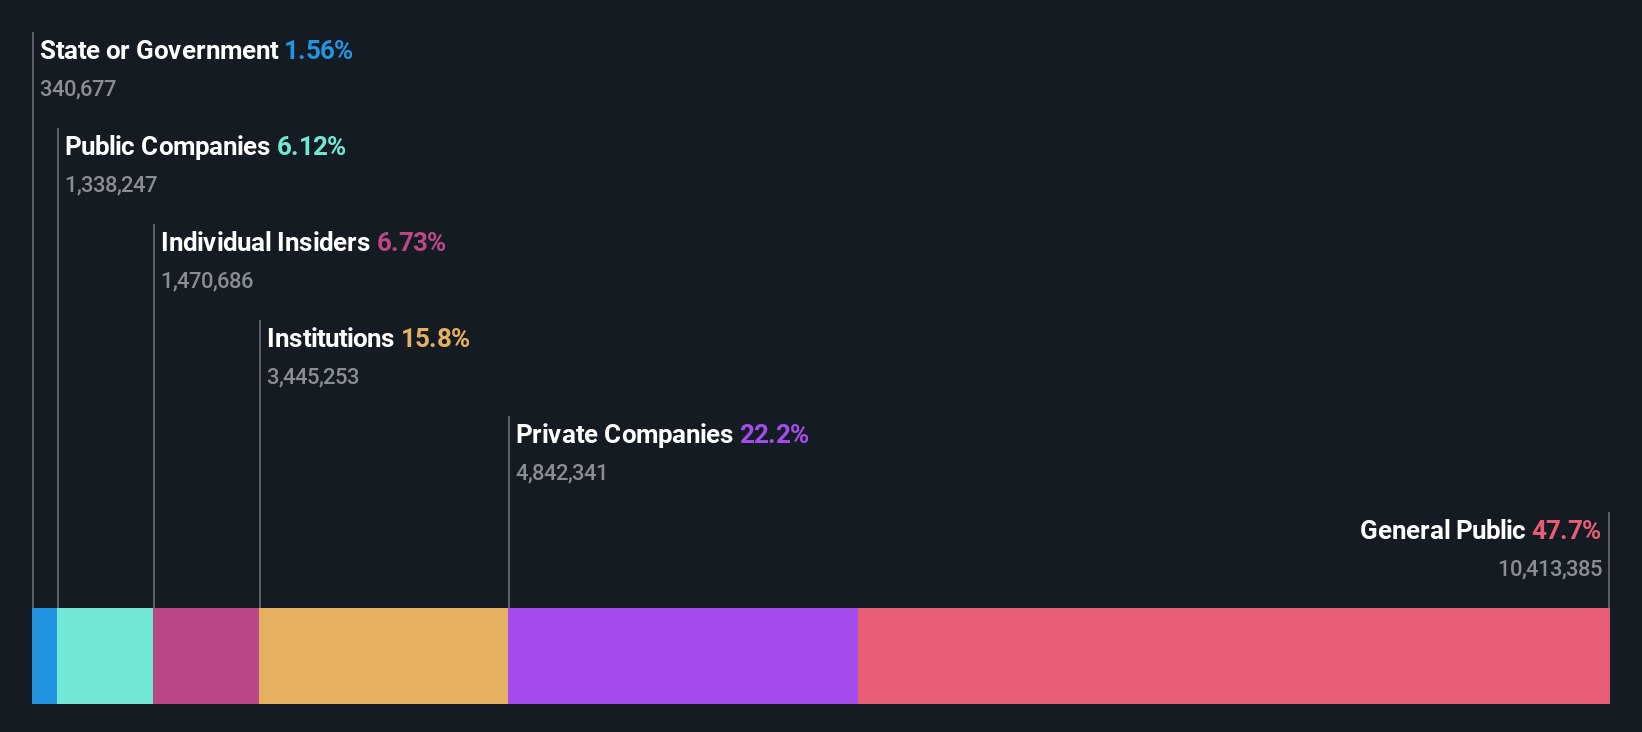
- 16% of Century Enka is held by Institutions
If you want to know who really controls Century Enka Limited (NSE:CENTENKA), then you'll have to look at the makeup of its share registry. We can see that individual investors own the lion's share in the company with 48% ownership. In other words, the group stands to gain the most (or lose the most) from their investment into the company.
And following last week's 11% decline in share price, individual investors suffered the most losses.
Let's take a closer look to see what the different types of shareholders can tell us about Century Enka.
View our latest analysis for Century Enka
What Does The Institutional Ownership Tell Us About Century Enka?
Many institutions measure their performance against an index that approximates the local market. So they usually pay more attention to companies that are included in major indices.
We can see that Century Enka does have institutional investors; and they hold a good portion of the company's stock. This implies the analysts working for those institutions have looked at the stock and they like it. But just like anyone else, they could be wrong. It is not uncommon to see a big share price drop if two large institutional investors try to sell out of a stock at the same time. So it is worth checking the past earnings trajectory of Century Enka, (below). Of course, keep in mind that there are other factors to consider, too.

Century Enka is not owned by hedge funds. Our data shows that Birla Group Holdings Private Limited is the largest shareholder with 17% of shares outstanding. quant Money Managers Ltd. is the second largest shareholder owning 7.9% of common stock, and Aditya Birla Real Estate Limited holds about 5.8% of the company stock.
A closer look at our ownership figures suggests that the top 14 shareholders have a combined ownership of 50% implying that no single shareholder has a majority.
While it makes sense to study institutional ownership data for a company, it also makes sense to study analyst sentiments to know which way the wind is blowing. We're not picking up on any analyst coverage of the stock at the moment, so the company is unlikely to be widely held.
Insider Ownership Of Century Enka
The definition of company insiders can be subjective and does vary between jurisdictions. Our data reflects individual insiders, capturing board members at the very least. Company management run the business, but the CEO will answer to the board, even if he or she is a member of it.
Insider ownership is positive when it signals leadership are thinking like the true owners of the company. However, high insider ownership can also give immense power to a small group within the company. This can be negative in some circumstances.
Shareholders would probably be interested to learn that insiders own shares in Century Enka Limited. As individuals, the insiders collectively own ₹613m worth of the ₹9.1b company. It is good to see some investment by insiders, but we usually like to see higher insider holdings. It might be worth checking if those insiders have been buying.
General Public Ownership
The general public, who are usually individual investors, hold a 48% stake in Century Enka. While this group can't necessarily call the shots, it can certainly have a real influence on how the company is run.
Private Company Ownership
We can see that Private Companies own 22%, of the shares on issue. It might be worth looking deeper into this. If related parties, such as insiders, have an interest in one of these private companies, that should be disclosed in the annual report. Private companies may also have a strategic interest in the company.
Public Company Ownership
Public companies currently own 6.1% of Century Enka stock. It's hard to say for sure but this suggests they have entwined business interests. This might be a strategic stake, so it's worth watching this space for changes in ownership.
Next Steps:
It's always worth thinking about the different groups who own shares in a company. But to understand Century Enka better, we need to consider many other factors. For example, we've discovered 2 warning signs for Century Enka (1 is significant!) that you should be aware of before investing here.
Of course this may not be the best stock to buy. So take a peek at this free free list of interesting companies.
NB: Figures in this article are calculated using data from the last twelve months, which refer to the 12-month period ending on the last date of the month the financial statement is dated. This may not be consistent with full year annual report figures.
Have feedback on this article? Concerned about the content? Get in touch with us directly. Alternatively, email editorial-team (at) simplywallst.com.
This article by Simply Wall St is general in nature. We provide commentary based on historical data and analyst forecasts only using an unbiased methodology and our articles are not intended to be financial advice. It does not constitute a recommendation to buy or sell any stock, and does not take account of your objectives, or your financial situation. We aim to bring you long-term focused analysis driven by fundamental data. Note that our analysis may not factor in the latest price-sensitive company announcements or qualitative material. Simply Wall St has no position in any stocks mentioned.