
 Nasdaq
 华尔街日报
华尔街日报Is Zillow Stock Attractive After Housing Super App Expansion And Mixed Long Term Returns?
- Wondering if Zillow Group at around $71.89 is quietly turning into a value opportunity or still trading on old housing bubble hype? This breakdown will walk through what the current price is really baking in.
- The stock has been almost flat in the short term, up just 0.4% over the last week and 1.5% over the past month. However, that masks a wild ride of 108.7% gains over three years, alongside a 47.8% drop over five years and an 8.9% slide in the last year.
- Recently, Zillow has been in the headlines for doubling down on its role as a housing super app, expanding partnerships with mortgage and rental platforms, and refining its marketplace tools for buyers, sellers, and renters. At the same time, ongoing uncertainty in the housing market and shifting mortgage rates have kept sentiment choppy, which helps explain why the share price has struggled to find a clear direction.
- On our valuation framework, Zillow Group currently scores 3 out of 6 on undervaluation checks, as shown by its valuation score. Next, we will unpack how different valuation approaches judge that price tag, before finishing with a more holistic way to think about what the stock is really worth.
Find out why Zillow Group's -8.9% return over the last year is lagging behind its peers.
Approach 1: Zillow Group Discounted Cash Flow (DCF) Analysis
A Discounted Cash Flow model estimates what a business is worth by projecting the cash it can generate in the future and then discounting those cash flows back to today, using a required rate of return.
For Zillow Group, the latest twelve month Free Cash Flow is about $190.4 Million. Analysts and extrapolated estimates see this rising significantly, with projections reaching roughly $1.99 Billion in Free Cash Flow by 2035. These longer term projections go beyond the usual five year analyst window. Simply Wall St extends the trend based on expected growth patterns.
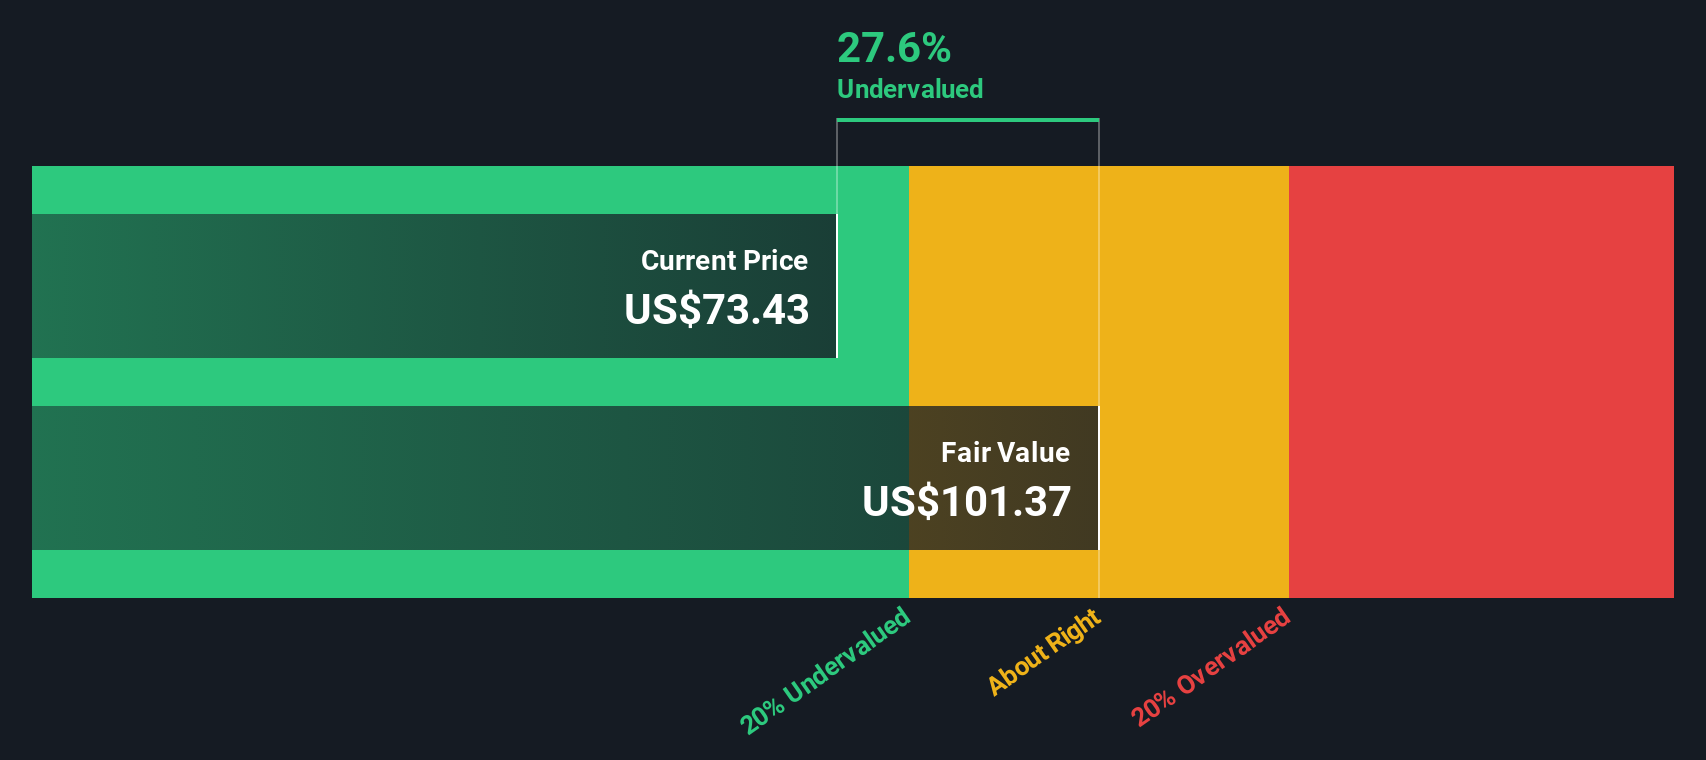
When all those future cash flows are discounted back to today using a 2 Stage Free Cash Flow to Equity model, the estimated intrinsic value for Zillow Group comes out at $101.36 per share. Compared with the current share price of around $71.89, the model implies the stock is about 29.1% undervalued on a DCF basis.
Result: UNDERVALUED
Our Discounted Cash Flow (DCF) analysis suggests Zillow Group is undervalued by 29.1%. Track this in your watchlist or portfolio, or discover 902 more undervalued stocks based on cash flows.
Approach 2: Zillow Group Price vs Sales
For a business like Zillow Group that is still leaning more on scaling revenue than on consistent bottom line profits, the Price to Sales, or P S, ratio is often a cleaner way to compare valuation than earnings based metrics. Investors typically accept a higher sales multiple when they expect stronger future growth or view the business model as relatively low risk. In contrast, slower growth or higher uncertainty usually warrants a lower, more conservative multiple.
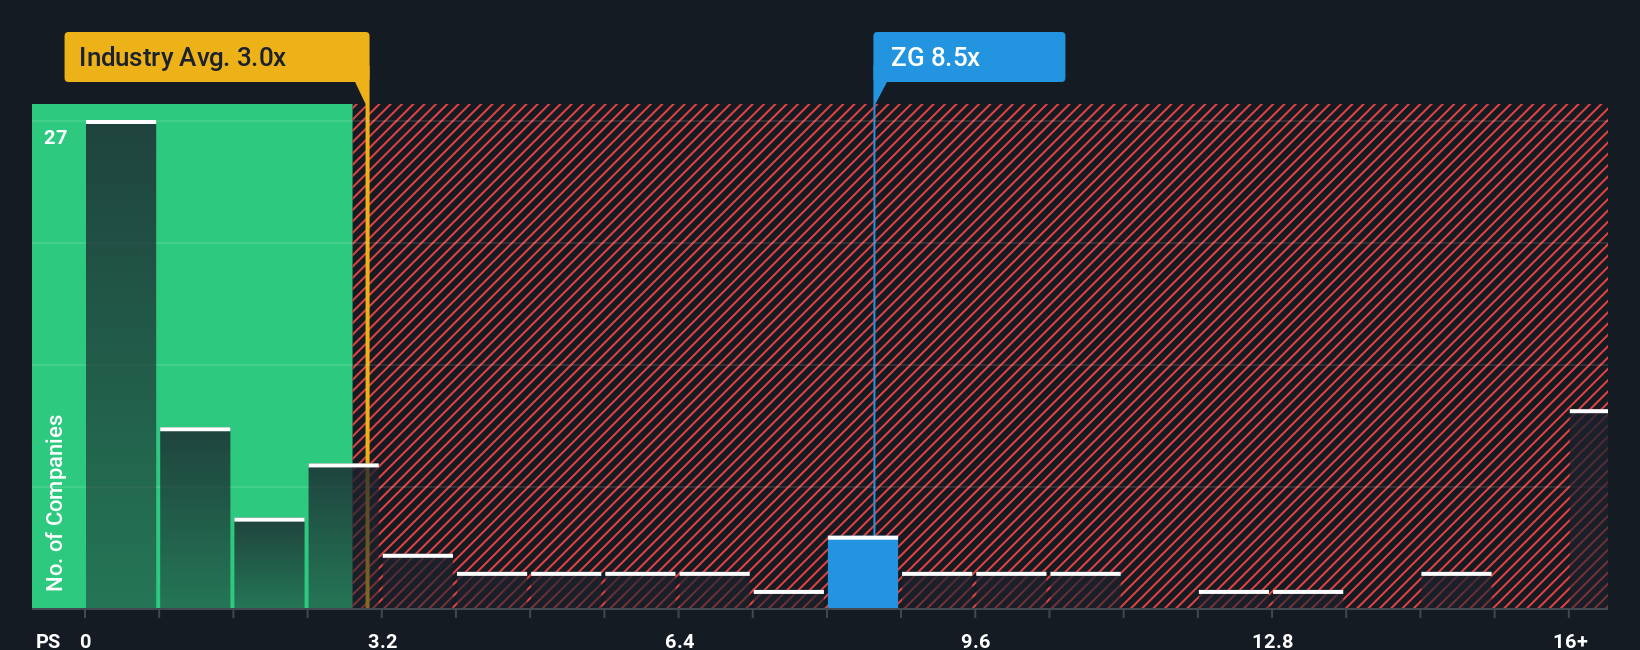
Zillow currently trades at about 7.01x sales, which is more than double the broader Real Estate industry average of roughly 2.14x and well above the peer group average of around 3.15x. Simply Wall St’s Fair Ratio framework estimates that, after factoring in Zillow’s growth outlook, profitability profile, industry positioning, market cap and risk, a more appropriate multiple would be closer to 4.81x sales. This Fair Ratio is more informative than a simple peer or sector comparison because it adjusts for the company’s specific fundamentals rather than assuming all real estate platforms should trade at similar levels.
With the actual P S of 7.01x sitting materially above the 4.81x Fair Ratio, Zillow Group screens as overvalued on this metric.
Result: OVERVALUED
PS ratios tell one story, but what if the real opportunity lies elsewhere? Discover 1450 companies where insiders are betting big on explosive growth.
Upgrade Your Decision Making: Choose your Zillow Group Narrative
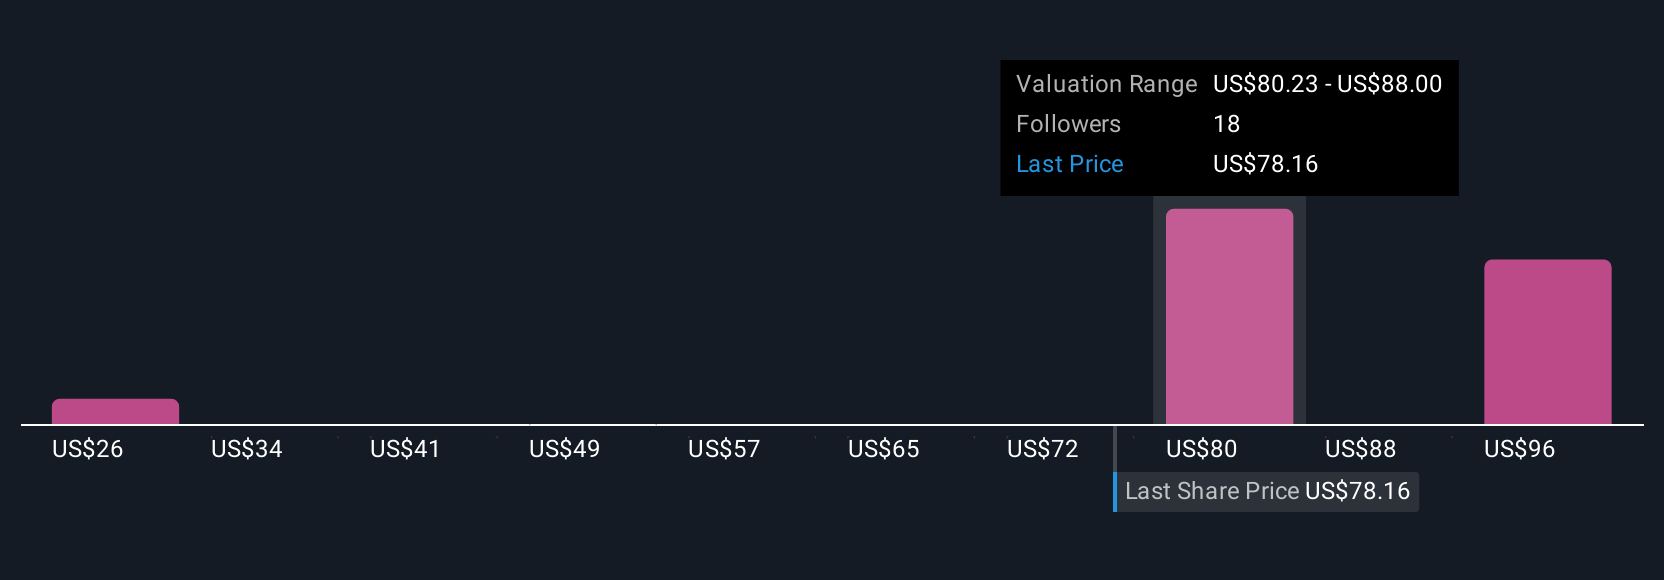
Earlier we mentioned that there is an even better way to understand valuation, so let us introduce you to Narratives, a simple idea where you write the story behind your numbers by pairing your view of a company’s future revenue, earnings and margins with a financial forecast that leads all the way to a Fair Value estimate. On Simply Wall St’s Community page, used by millions of investors, Narratives make this process accessible by guiding you to connect what you believe about Zillow Group’s competitive position, growth drivers and risks with concrete forecast assumptions, then compare the resulting Fair Value to today’s share price to inform whether it looks like a buy, hold or sell. Because Narratives are updated dynamically as new earnings, news or guidance arrive, your view stays living rather than static. You can also see how other investors disagree. For example, one Zillow Narrative might assume a Fair Value near $100 based on specific growth and margin assumptions, while a more cautious Narrative could sit closer to $66 if it assumes slower adoption of new products and ongoing housing market headwinds.
Do you think there's more to the story for Zillow Group? Head over to our Community to see what others are saying!
This article by Simply Wall St is general in nature. We provide commentary based on historical data and analyst forecasts only using an unbiased methodology and our articles are not intended to be financial advice. It does not constitute a recommendation to buy or sell any stock, and does not take account of your objectives, or your financial situation. We aim to bring you long-term focused analysis driven by fundamental data. Note that our analysis may not factor in the latest price-sensitive company announcements or qualitative material. Simply Wall St has no position in any stocks mentioned.
Have feedback on this article? Concerned about the content? Get in touch with us directly. Alternatively, email editorial-team@simplywallst.com