
 Nasdaq
 华尔街日报
华尔街日报Earnings Preview For G-III Apparel Group
G-III Apparel Group (NASDAQ:GIII) is preparing to release its quarterly earnings on Tuesday, 2025-12-09. Here's a brief overview of what investors should keep in mind before the announcement.
Analysts expect G-III Apparel Group to report an earnings per share (EPS) of $1.61.
G-III Apparel Group bulls will hope to hear the company announce they've not only beaten that estimate, but also to provide positive guidance, or forecasted growth, for the next quarter.
New investors should note that it is sometimes not an earnings beat or miss that most affects the price of a stock, but the guidance (or forecast).
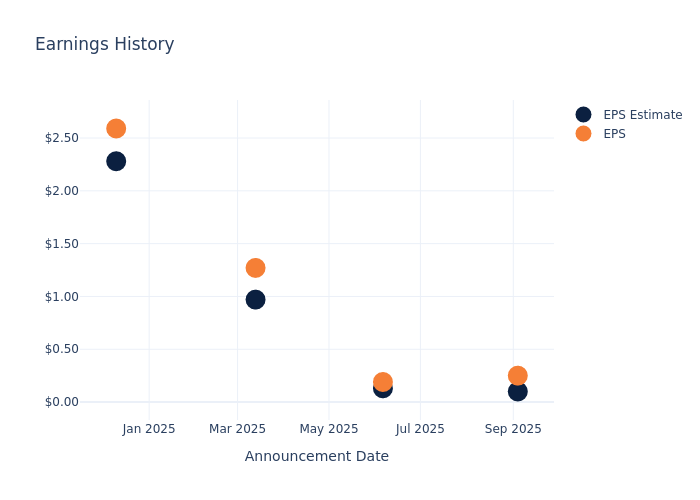
Overview of Past Earnings
The company's EPS beat by $0.15 in the last quarter, leading to a 6.04% drop in the share price on the following day.
Here's a look at G-III Apparel Group's past performance and the resulting price change:
| Quarter | Q2 2026 | Q1 2026 | Q4 2025 | Q3 2025 |
|---|---|---|---|---|
| EPS Estimate | 0.10 | 0.13 | 0.97 | 2.28 |
| EPS Actual | 0.25 | 0.19 | 1.27 | 2.59 |
| Price Change % | -6.00 | -19.00 | 2.00 | 1.00 |
Market Performance of G-III Apparel Group's Stock
Shares of G-III Apparel Group were trading at $30.38 as of December 05. Over the last 52-week period, shares are down 14.11%. Given that these returns are generally negative, long-term shareholders are likely bearish going into this earnings release.
Analyst Observations about G-III Apparel Group
Understanding market sentiments and expectations within the industry is crucial for investors. This analysis delves into the latest insights on G-III Apparel Group.
With 3 analyst ratings, G-III Apparel Group has a consensus rating of Neutral. The average one-year price target is $30.0, indicating a potential 1.25% downside.
Analyzing Ratings Among Peers
In this analysis, we delve into the analyst ratings and average 1-year price targets of Carter's, Canada Goose Holdings and Oxford Industries, three key industry players, offering insights into their relative performance expectations and market positioning.
- Analysts currently favor an Underperform trajectory for Carter's, with an average 1-year price target of $28.2, suggesting a potential 7.18% downside.
- Analysts currently favor an Neutral trajectory for Canada Goose Holdings, with an average 1-year price target of $11.67, suggesting a potential 61.59% downside.
- Analysts currently favor an Neutral trajectory for Oxford Industries, with an average 1-year price target of $47.25, suggesting a potential 55.53% upside.
Analysis Summary for Peers
The peer analysis summary offers a detailed examination of key metrics for Carter's, Canada Goose Holdings and Oxford Industries, providing valuable insights into their respective standings within the industry and their market positions and comparative performance.
| Company | Consensus | Revenue Growth | Gross Profit | Return on Equity |
|---|---|---|---|---|
| G-III Apparel Group | Neutral | -4.88% | $250.47M | 0.64% |
| Carter's | Underperform | -0.08% | $341.63M | 1.31% |
| Canada Goose Holdings | Neutral | 1.79% | $170.10M | -3.55% |
| Oxford Industries | Neutral | -3.99% | $247.62M | 2.81% |
Key Takeaway:
G-III Apparel Group ranks in the middle for consensus rating. It is at the bottom for revenue growth and gross profit, but at the top for return on equity among its peers.
Discovering G-III Apparel Group: A Closer Look
G-III Apparel Group Ltd is a textile company. It makes a wide range of apparel, footwear, and accessories that it sells under its own brands, licensed brands, and private-label brands. G-III has a substantial portfolio for licensed and proprietary brands, anchored by five global power brands: DKNY, Donna Karan, Calvin Klein, Tommy Hilfiger, and Karl Lagerfeld. The company has two reportable operations: Wholesale Operations and Retail Operations. The Wholesale operations segment includes sales of products under brands licensed by from third parties, as well as sales of products under its own brands and private label brands. The retail operations segment consists of Wilsons Leather, G.H. Bass, and DKNY retail stores. It derives majority of its revenues from Wholesale operations.
Financial Milestones: G-III Apparel Group's Journey
Market Capitalization Analysis: The company's market capitalization is below the industry average, suggesting that it is relatively smaller compared to peers. This could be due to various factors, including perceived growth potential or operational scale.
Revenue Growth: G-III Apparel Group's revenue growth over a period of 3 months has faced challenges. As of 31 July, 2025, the company experienced a revenue decline of approximately -4.88%. This indicates a decrease in the company's top-line earnings. As compared to its peers, the revenue growth lags behind its industry peers. The company achieved a growth rate lower than the average among peers in Consumer Discretionary sector.
Net Margin: G-III Apparel Group's net margin is below industry standards, pointing towards difficulties in achieving strong profitability. With a net margin of 1.78%, the company may encounter challenges in effective cost control.
Return on Equity (ROE): G-III Apparel Group's ROE is below industry averages, indicating potential challenges in efficiently utilizing equity capital. With an ROE of 0.64%, the company may face hurdles in achieving optimal financial returns.
Return on Assets (ROA): G-III Apparel Group's ROA is below industry averages, indicating potential challenges in efficiently utilizing assets. With an ROA of 0.43%, the company may face hurdles in achieving optimal financial returns.
Debt Management: G-III Apparel Group's debt-to-equity ratio is below the industry average. With a ratio of 0.17, the company relies less on debt financing, maintaining a healthier balance between debt and equity, which can be viewed positively by investors.
To track all earnings releases for G-III Apparel Group visit their earnings calendar on our site.
This article was generated by Benzinga's automated content engine and reviewed by an editor.