
 Nasdaq
 华尔街日报
华尔街日报Is Yum! Brands Still Attractive After Recent Rally And Valuation Premium?
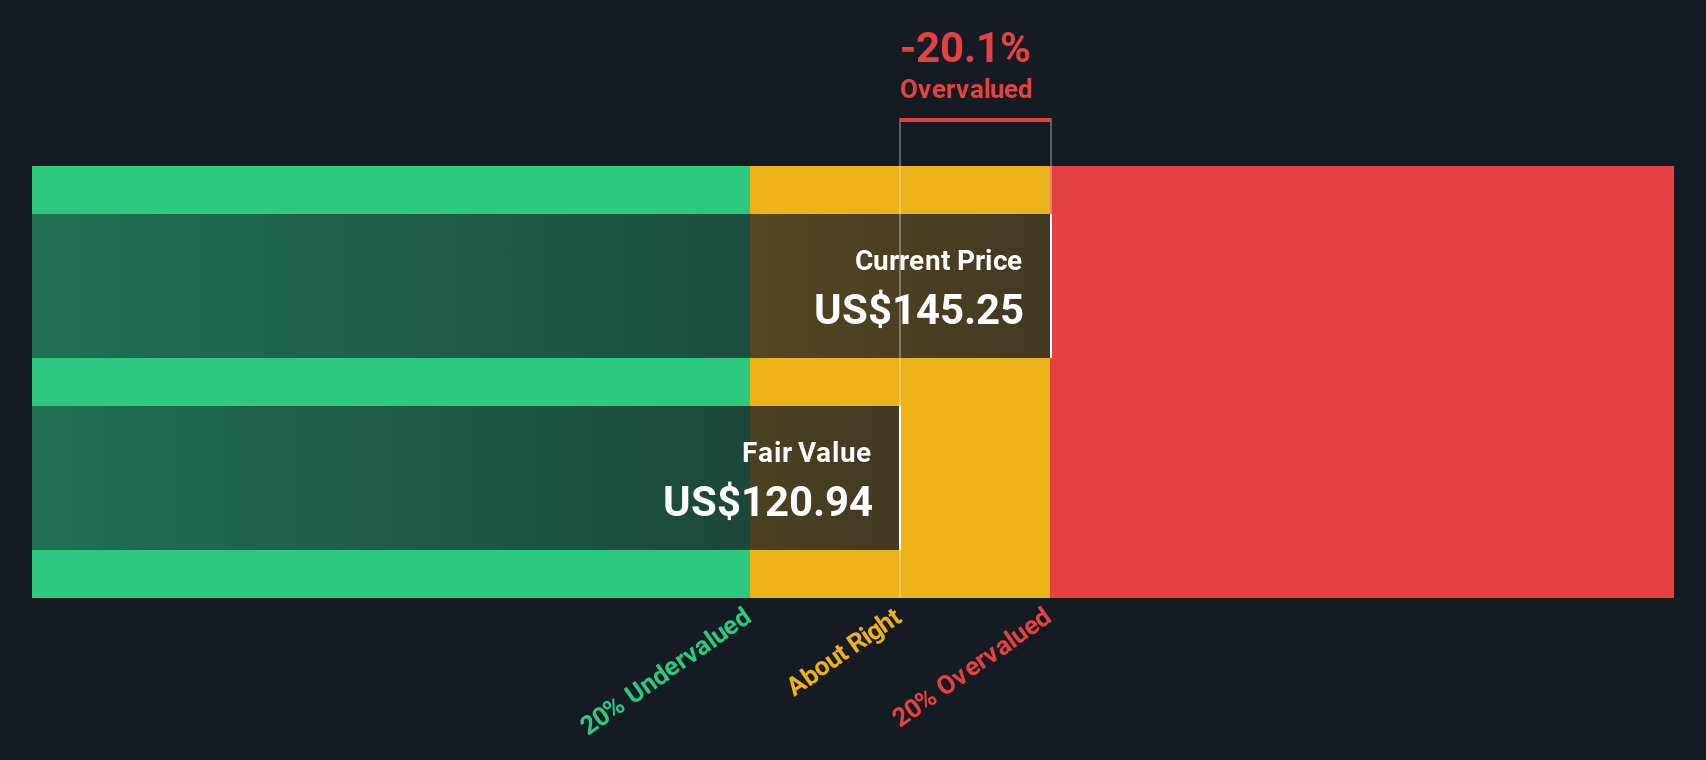
- If you are wondering whether Yum! Brands at around $145 a share still offers value or if most of the upside has already been eaten up, you are not alone. That is exactly what we are going to unpack here.
- Despite being up 8.5% year to date and 6.2% over the last year, the stock has pulled back about 3.8% over the past week and 2.8% over the last month. Depending on your risk appetite, that can make it feel like either a potential opportunity or a warning sign.
- Recent headlines have focused on Yum! Brands strategic push to expand its global footprint, deepen its digital ordering and delivery capabilities, and lean into asset light franchising to support long term growth. At the same time, investors are digesting shifting consumer spending patterns and competitive pressures across the fast food space, which helps explain some of the recent volatility.
- On our framework, Yum! Brands currently scores a 0/6 valuation check score, suggesting it does not screen as obviously undervalued on traditional metrics. Next, we will walk through the main valuation approaches and then wrap up with a more holistic way to think about what the stock is really worth.
Yum! Brands scores just 0/6 on our valuation checks. See what other red flags we found in the full valuation breakdown.
Approach 1: Yum! Brands Discounted Cash Flow (DCF) Analysis
A Discounted Cash Flow model estimates what a company is worth by projecting the cash it can generate in the future and discounting those cash flows back to today, using an appropriate rate to reflect risk and time.
For Yum! Brands, the latest twelve month Free Cash Flow is about $1.58 billion. Analysts and extrapolated estimates used in this 2 Stage Free Cash Flow to Equity model see cash flows rising toward roughly $2.50 billion by 2035, with a path that includes forecast years such as $1.89 billion in 2026 and just over $2.35 billion in 2028. Earlier years are based on analyst forecasts, while the later years are Simply Wall St extrapolations that assume moderating growth as the business matures.
When these projected cash flows are discounted back to today, the model arrives at an intrinsic value of about $118.90 per share. Compared with the current share price around $145, the DCF suggests the stock is roughly 21.9% overvalued, indicating that investors are paying a notable premium relative to the modelled cash flow outlook.
Result: OVERVALUED
Our Discounted Cash Flow (DCF) analysis suggests Yum! Brands may be overvalued by 21.9%. Discover 905 undervalued stocks or create your own screener to find better value opportunities.
Approach 2: Yum! Brands Price vs Earnings
For profitable, mature businesses like Yum! Brands, the Price to Earnings ratio is a practical way to gauge whether investors are paying a sensible price for each dollar of current earnings. It naturally incorporates the market’s expectations for growth and risk, since faster growing or lower risk companies usually command higher PE ratios, while slower or riskier names trade on lower multiples.
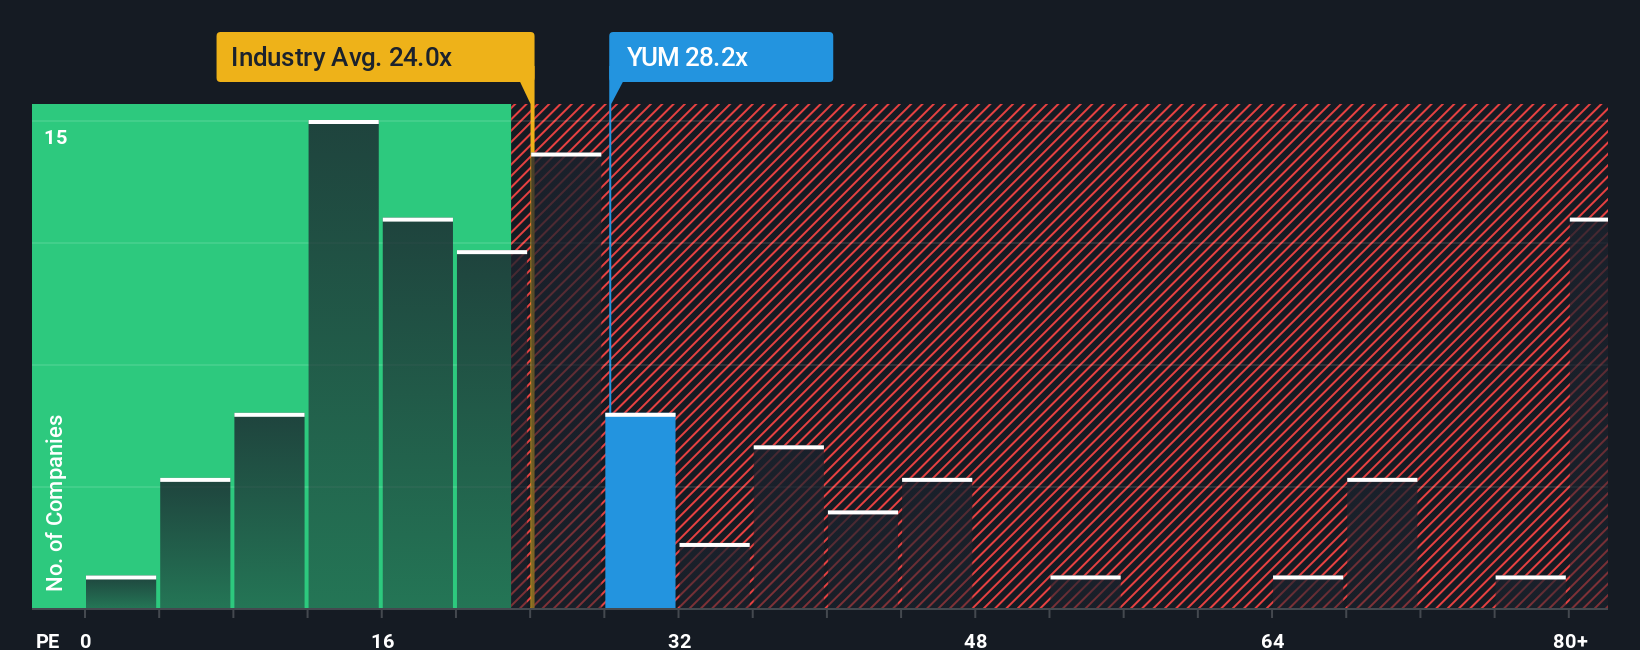
Yum! Brands currently trades on a PE of about 27.8x, which is above both the Hospitality industry average of roughly 23.3x and the broader peer average of around 23.0x. That premium suggests investors are already pricing in stronger prospects or a higher quality profile than many competitors. However, simple peer and industry comparisons can miss important company specific factors.
Simply Wall St’s Fair Ratio for Yum! Brands is 26.3x, a proprietary estimate of what a reasonable PE should be after accounting for its earnings growth outlook, profitability, risk profile, industry positioning and market cap. Because it blends these fundamentals, the Fair Ratio can be more informative than headline comparisons alone. With the shares at 27.8x versus a Fair Ratio of 26.3x, the stock screens as modestly expensive on this framework.
Result: OVERVALUED
PE ratios tell one story, but what if the real opportunity lies elsewhere? Discover 1450 companies where insiders are betting big on explosive growth.
Upgrade Your Decision Making: Choose your Yum! Brands Narrative
Earlier we mentioned that there is an even better way to understand valuation, so let us introduce you to Narratives, a simple way to connect your view of Yum! Brands story with the numbers behind its future revenue, earnings, margins and ultimately its fair value.
A Narrative is your personal storyline for a company, where you spell out what you think will drive the business, translate that into a financial forecast, and then see what that implies for a fair value per share instead of just accepting a static PE or DCF output.
On Simply Wall St, Narratives live inside the Community page used by millions of investors, and they make it easy to compare your own fair value to the current market price so you can decide whether Yum! Brands looks like a buy, a hold, or a sell based on your assumptions.
Because Narratives update as new information, like earnings results or major news on Pizza Hut or Taco Bell, flows into the platform, your valuation view evolves in real time and can differ meaningfully from other investors, from a more cautious perspective closer to $142 per share to a more optimistic stance nearer $185 per share.
Do you think there's more to the story for Yum! Brands? Head over to our Community to see what others are saying!

This article by Simply Wall St is general in nature. We provide commentary based on historical data and analyst forecasts only using an unbiased methodology and our articles are not intended to be financial advice. It does not constitute a recommendation to buy or sell any stock, and does not take account of your objectives, or your financial situation. We aim to bring you long-term focused analysis driven by fundamental data. Note that our analysis may not factor in the latest price-sensitive company announcements or qualitative material. Simply Wall St has no position in any stocks mentioned.
Have feedback on this article? Concerned about the content? Get in touch with us directly. Alternatively, email editorial-team@simplywallst.com