
 Nasdaq
 华尔街日报
华尔街日报Is Dover Stock a Long Term Opportunity After Push Into Industrial Automation?
- Wondering if Dover at around $191 a share is quietly turning into a value opportunity, or if the market already has it figured out? Let's unpack what the numbers are really saying.
- The stock has bounced 3.1% over the last week and 6.4% over the past month, yet it is still down 4.1% over the last year even after delivering 44.4% over 3 years and 67.9% over 5 years, a mix that hints at shifting expectations and possibly a reset in risk appetite.
- Recent headlines have focused on Dover's continued push into industrial automation and sustainable solutions, including expanding its portfolio in engineered products that serve long cycle infrastructure and manufacturing demand. At the same time, analysts have been revisiting their long term growth and margin assumptions as these strategic initiatives mature, which helps explain some of the recent volatility in the share price.
- Right now, Dover scores a 4/6 on our valuation checks, suggesting pockets of undervaluation that basic multiples do not fully capture. In the rest of this article we walk through the main valuation approaches, before finishing with a more complete way to think about what Dover might really be worth.
Find out why Dover's -4.1% return over the last year is lagging behind its peers.
Approach 1: Dover Discounted Cash Flow (DCF) Analysis
A Discounted Cash Flow model estimates what a business is worth today by projecting its future cash flows and discounting them back to the present. For Dover, the model uses a 2 Stage Free Cash Flow to Equity framework built on $592 million of last twelve months free cash flow and analyst forecasts that see free cash flow rising to about $1.65 billion by 2028, with further years extrapolated beyond that horizon.
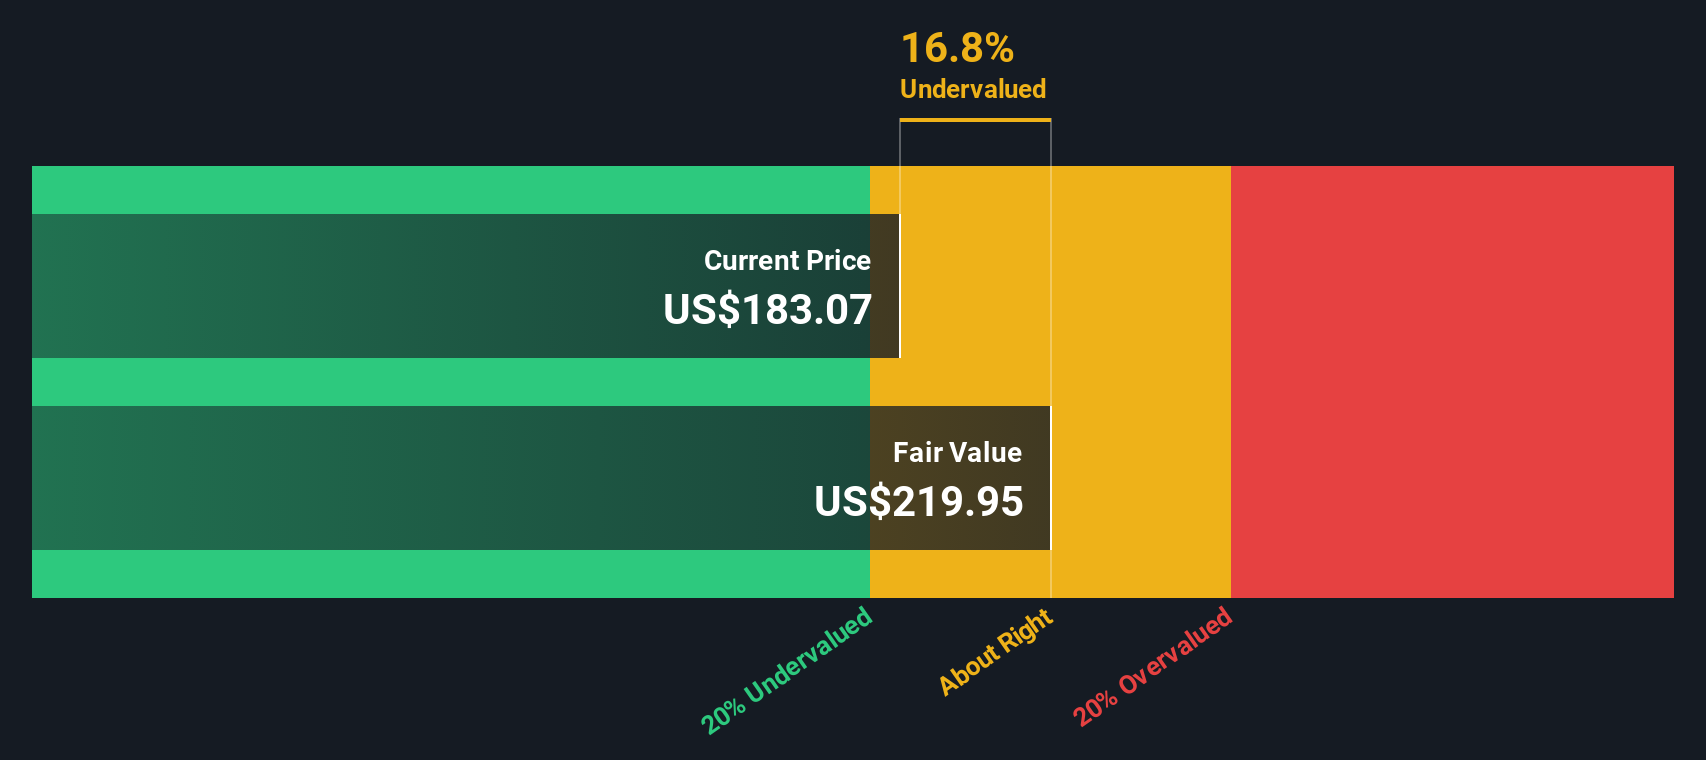
These cash flows, all in $, are projected out over ten years and then discounted using a required return to reflect risk and the time value of money. Summing those discounted cash flows and a terminal value produces an estimated intrinsic value of roughly $231.81 per share. Compared with the current share price of about $191, the DCF implies Dover is trading at a 17.6% discount to its calculated fair value. This suggests the market is underpricing the company based on its projected cash generation.
Result: UNDERVALUED
Our Discounted Cash Flow (DCF) analysis suggests Dover is undervalued by 17.6%. Track this in your watchlist or portfolio, or discover 906 more undervalued stocks based on cash flows.
Approach 2: Dover Price vs Earnings
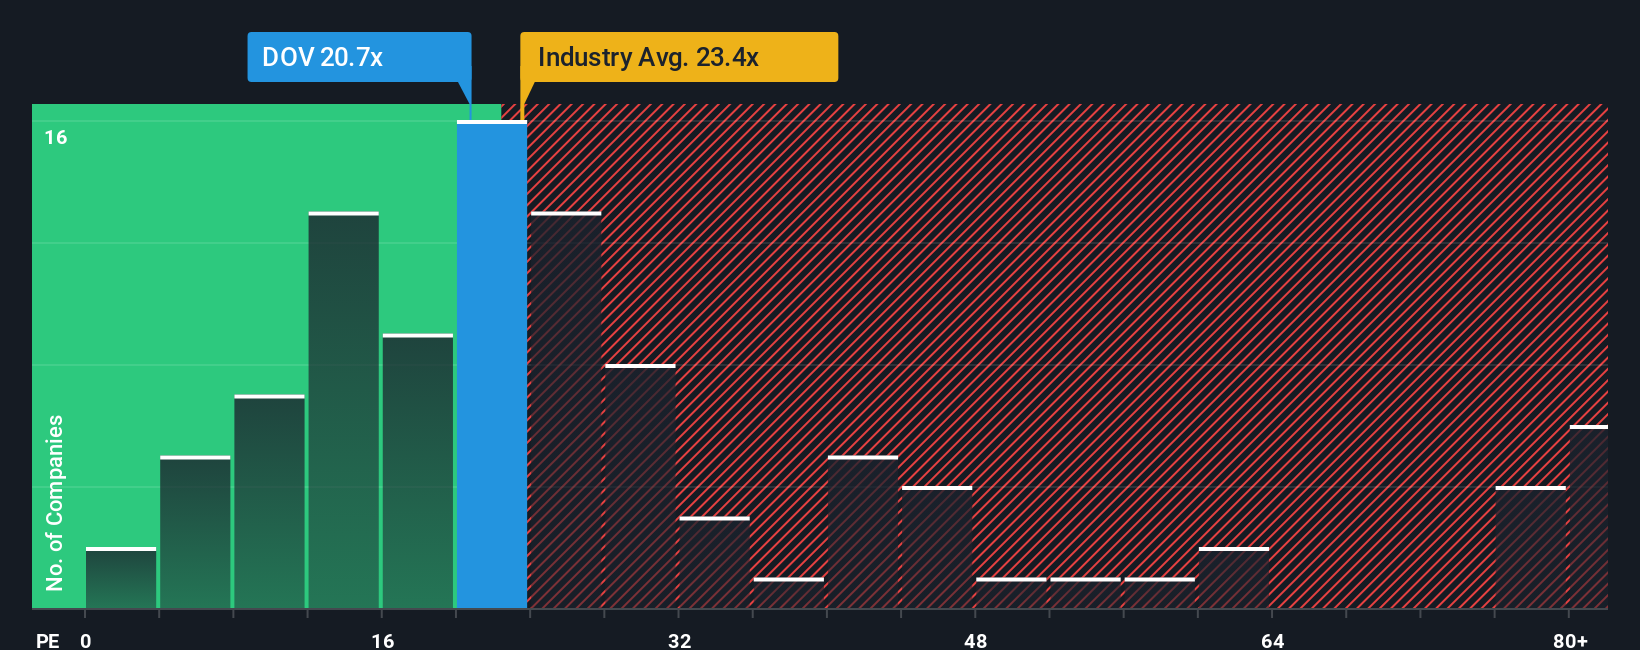
For consistently profitable businesses like Dover, the price to earnings ratio is a practical way to gauge how much investors are willing to pay for each dollar of current profits. In simple terms, higher growth prospects and lower perceived risk usually justify a higher PE multiple, while slower or more volatile earnings tend to warrant a lower one.
Dover currently trades on about 24.7x earnings, which is slightly below the broader Machinery industry average of around 25.5x and well under the peer group average of roughly 31.7x. To move beyond these blunt comparisons, Simply Wall St estimates a Fair Ratio of 27.6x for Dover, based on factors such as its earnings growth outlook, profitability, industry positioning, market cap and specific risk profile.
This Fair Ratio is more tailored than a simple industry or peer check because it adjusts for Dover’s own fundamentals rather than assuming all Machinery stocks deserve the same multiple. Comparing the Fair Ratio of 27.6x with the current 24.7x suggests the shares trade at a discount to what would be expected given the company’s characteristics.
Result: UNDERVALUED
PE ratios tell one story, but what if the real opportunity lies elsewhere? Discover 1442 companies where insiders are betting big on explosive growth.
Upgrade Your Decision Making: Choose your Dover Narrative
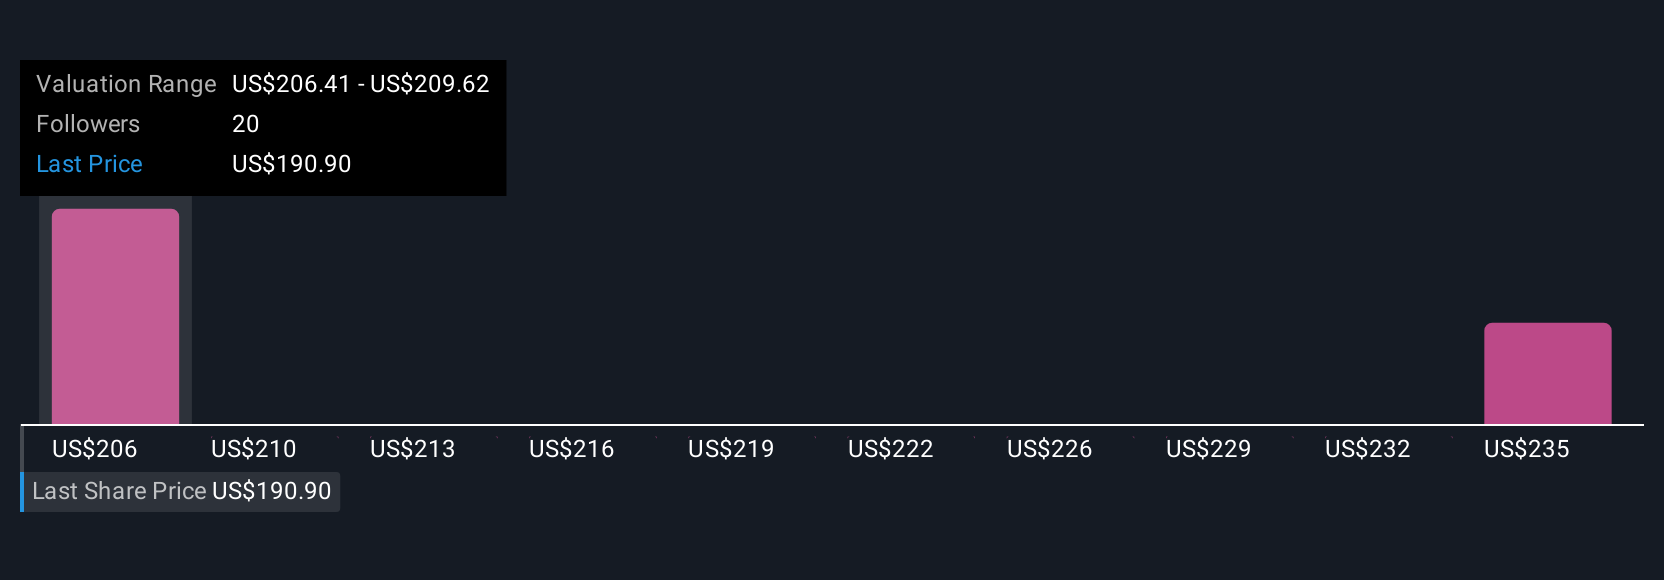
Earlier we mentioned that there is an even better way to understand valuation, so let us introduce you to Narratives, which are simply your story about a company translated into numbers like future revenue, earnings, margins and a fair value estimate. A Narrative connects what you believe about Dover’s strategy, markets and execution to an explicit financial forecast and then to a fair value that you can compare directly to today’s share price to assess whether it looks like a buy, hold or sell. On Simply Wall St, Narratives are an easy to use tool on the Community page used by millions of investors. They update dynamically as fresh information such as earnings results, news or guidance changes the outlook. For Dover, one investor might build a bullish Narrative that assumes 5 percent plus annual revenue growth, resilient margins and a fair value closer to $235 per share. A more cautious investor might emphasize cyclical risks, slower growth and margin pressure and land on a fair value nearer $168. Narratives allow both views to be made explicit, compared and continuously refined over time.
Do you think there's more to the story for Dover? Head over to our Community to see what others are saying!
This article by Simply Wall St is general in nature. We provide commentary based on historical data and analyst forecasts only using an unbiased methodology and our articles are not intended to be financial advice. It does not constitute a recommendation to buy or sell any stock, and does not take account of your objectives, or your financial situation. We aim to bring you long-term focused analysis driven by fundamental data. Note that our analysis may not factor in the latest price-sensitive company announcements or qualitative material. Simply Wall St has no position in any stocks mentioned.
Have feedback on this article? Concerned about the content? Get in touch with us directly. Alternatively, email editorial-team@simplywallst.com