
 Nasdaq
 华尔街日报
华尔街日报Is Klarna Group Attractive After AI Credit Expansion Amid Sharp Share Price Swings?
- If you are wondering whether Klarna Group at $32.50 is a bargain in the making or a value trap, you are not alone, and this is exactly what we are going to unpack.
- Over the last week the stock has climbed 4.9%, but that bounce still leaves it down 11.9% over 30 days and 29.1% year to date, which suggests that market sentiment has been shifting quickly.
- Recent headlines have focused on Klarna's push deeper into AI driven credit decisioning and its continued expansion of buy now, pay later partnerships with major retailers. Both factors have sharpened investor attention on its growth runway. At the same time, regulatory scrutiny around consumer lending practices and tighter funding conditions have added a layer of caution to the story.
- On our checklist of undervaluation signals Klarna scores just 1 out of 6. We will break down what different valuation methods are indicating, then finish by looking at a more complete way to judge whether the current price really makes sense.
Klarna Group scores just 1/6 on our valuation checks. See what other red flags we found in the full valuation breakdown.
Approach 1: Klarna Group Excess Returns Analysis
The Excess Returns model looks at whether Klarna is generating returns on shareholder capital that exceed its cost of equity, and how sustainable those returns are over time.
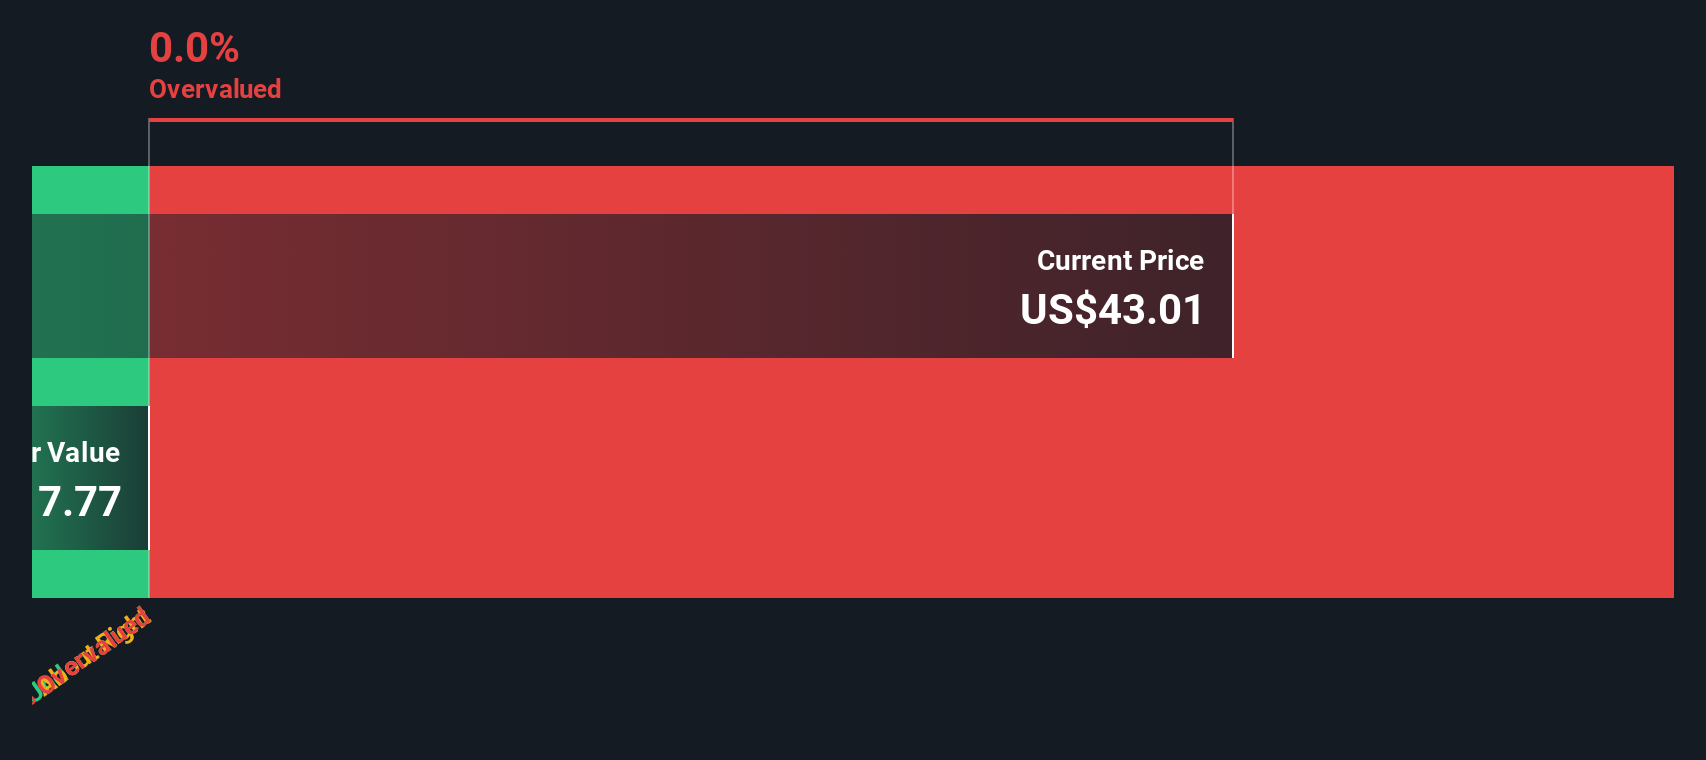
For Klarna, the numbers are not encouraging. The company has a Book Value of $6.49 per share and a Stable EPS estimate of $0.27 per share, based on weighted future Return on Equity estimates from 8 analysts. Against this, the Cost of Equity is a steep $0.67 per share, which results in an Excess Return of about $-0.40 per share.
In other words, with an average Return on Equity of only 3.37% and a projected Stable Book Value of $8.09 per share, Klarna is expected to earn less on its equity than it costs to fund that equity. The Excess Returns valuation, therefore, produces an intrinsic value close to zero relative to the current share price of $32.50, implying the stock is roughly 18950.4% overvalued.
Result: OVERVALUED
Our Excess Returns analysis suggests Klarna Group may be overvalued by 18950.4%. Discover 909 undervalued stocks or create your own screener to find better value opportunities.
Approach 2: Klarna Group Price vs Sales
For growing, but not yet consistently profitable, fintechs like Klarna, the price to sales multiple is often a more reliable yardstick than earnings based metrics, because revenue tends to be more stable than profits while the business is still scaling.
In general, faster and more predictable revenue growth, stronger margins and lower risk justify a higher sales multiple. Slower growth, thinner margins or greater uncertainty point to a lower, more conservative range. Against that backdrop, Klarna currently trades on a price to sales ratio of 3.82x, slightly above both its peer group at 3.62x and the broader Diversified Financial industry at 2.54x. This indicates that the market is already paying a premium for its growth story.
Simply Wall St’s Fair Ratio is designed to go a step further than simple peer or industry comparisons by estimating what sales multiple would be justified for Klarna, given its own growth profile, profitability, risk factors, industry dynamics and market cap. On this basis, the Fair Ratio comes in well below the current 3.82x, suggesting that, once those fundamentals are fully accounted for, the shares may be pricing in more optimism than the underlying metrics support at this stage.
Result: OVERVALUED
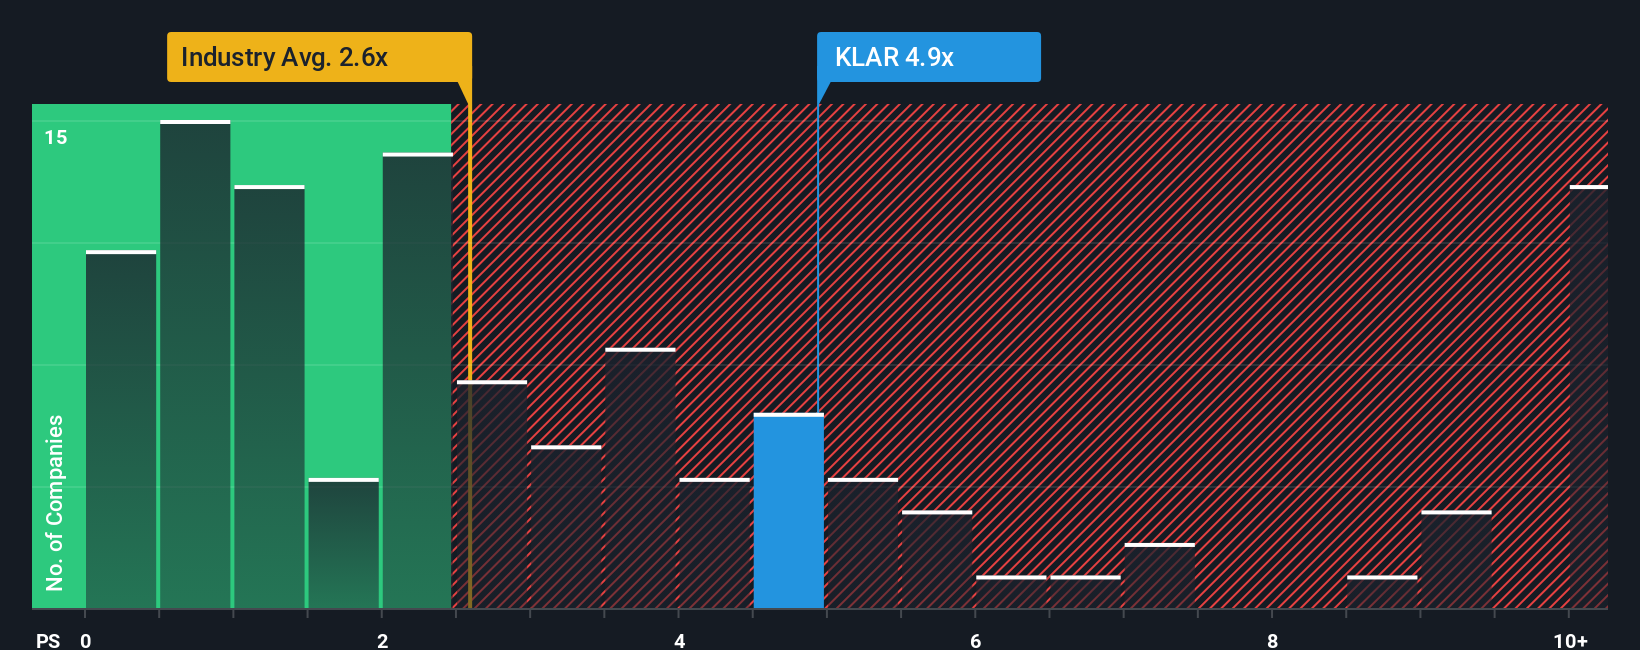
PS ratios tell one story, but what if the real opportunity lies elsewhere? Discover 1442 companies where insiders are betting big on explosive growth.
Upgrade Your Decision Making: Choose Your Klarna Group Narrative
Earlier we mentioned that there is an even better way to understand valuation. Let us introduce you to Narratives, a simple framework that lets you attach a clear story to your numbers. You can link your assumptions about Klarna Group’s future revenue, earnings and margins through to your estimate of fair value.
A Narrative on Simply Wall St’s Community page connects three things: what you believe about the business, the financial forecast that follows from that belief, and the fair value you calculate from that forecast. This makes it far easier to see whether the current share price lines up with your expectations.
Because Narratives are built into a platform used by millions of investors, they are easy to create, compare and refine. They also automatically update when fresh information such as earnings releases or major news arrives, so your view of Klarna’s fair value can evolve as new data becomes available.
This approach can help you quickly assess how your Narrative’s fair value compares to today’s price. It also allows you to see how other investors may be more optimistic or more cautious on Klarna by setting different assumptions that lead to much higher or lower fair values than your own.
Do you think there's more to the story for Klarna Group? Head over to our Community to see what others are saying!
This article by Simply Wall St is general in nature. We provide commentary based on historical data and analyst forecasts only using an unbiased methodology and our articles are not intended to be financial advice. It does not constitute a recommendation to buy or sell any stock, and does not take account of your objectives, or your financial situation. We aim to bring you long-term focused analysis driven by fundamental data. Note that our analysis may not factor in the latest price-sensitive company announcements or qualitative material. Simply Wall St has no position in any stocks mentioned.
Have feedback on this article? Concerned about the content? Get in touch with us directly. Alternatively, email editorial-team@simplywallst.com