
 Nasdaq
 华尔街日报
华尔街日报Does Universal Display’s 2025 Valuation Reflect OLED Growth After Recent Share Price Slide?
- Wondering if Universal Display at around $121 still has the makings of a long term winner, or if the market has already priced in the upside? This breakdown will help you decide whether the current tag looks like opportunity or risk.
- The stock has bounced 2.1% over the last week but is still down 17.2% over the past month, 18.8% year to date and 22.3% over the past year. This is a volatile pattern that hints at shifting market sentiment rather than a clear long term trend.
- Recent headlines around OLED adoption in smartphones, TVs and emerging form factors like foldables have kept Universal Display in the conversation as a key intellectual property and materials provider, even as competition in display technology intensifies. At the same time, macro worries about consumer electronics demand have weighed on sentiment for suppliers across the chain, providing important context for the stock’s choppy performance.
- On our numbers, Universal Display scores a 3/6 valuation score, suggesting it looks undervalued on some checks but not convincingly cheap on others. Next we will unpack the different valuation approaches we use to reach that view, and then finish with a more intuitive way to think about what the stock is really worth.
Find out why Universal Display's -22.3% return over the last year is lagging behind its peers.
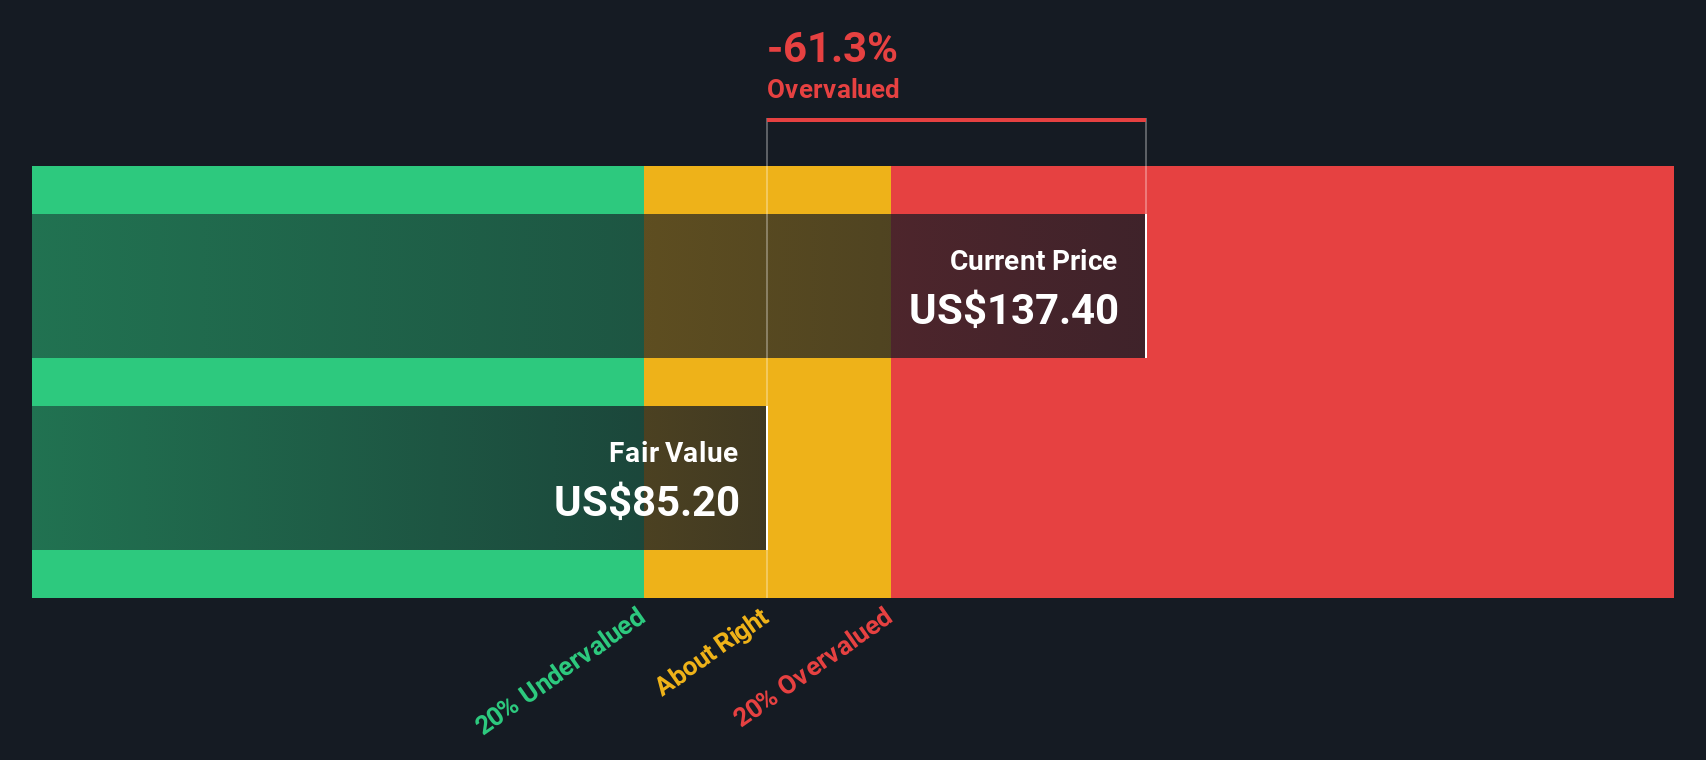
Approach 1: Universal Display Discounted Cash Flow (DCF) Analysis
A Discounted Cash Flow model estimates what a business is worth today by projecting its future cash flows and then discounting those back to the present using a required rate of return. For Universal Display, the model is a 2 Stage Free Cash Flow to Equity approach, focused on cash that could ultimately flow to shareholders.
The company generated around $137.3 Million in free cash flow over the last twelve months, and analysts expect this to climb steadily, with projections reaching about $401.6 Million by 2035. In the near term, forecasts call for free cash flow of roughly $291.9 Million in 2026 and $305.2 Million in 2027, with later years extrapolated by Simply Wall St using modest growth assumptions.
When all those projected cash flows are discounted back to today, the model arrives at an intrinsic value of about $87.59 per share. Compared with a market price around $121, the DCF implies the stock is roughly 38.7% overvalued, suggesting expectations in the current price run ahead of the modeled cash generation.
Result: OVERVALUED
Our Discounted Cash Flow (DCF) analysis suggests Universal Display may be overvalued by 38.7%. Discover 907 undervalued stocks or create your own screener to find better value opportunities.
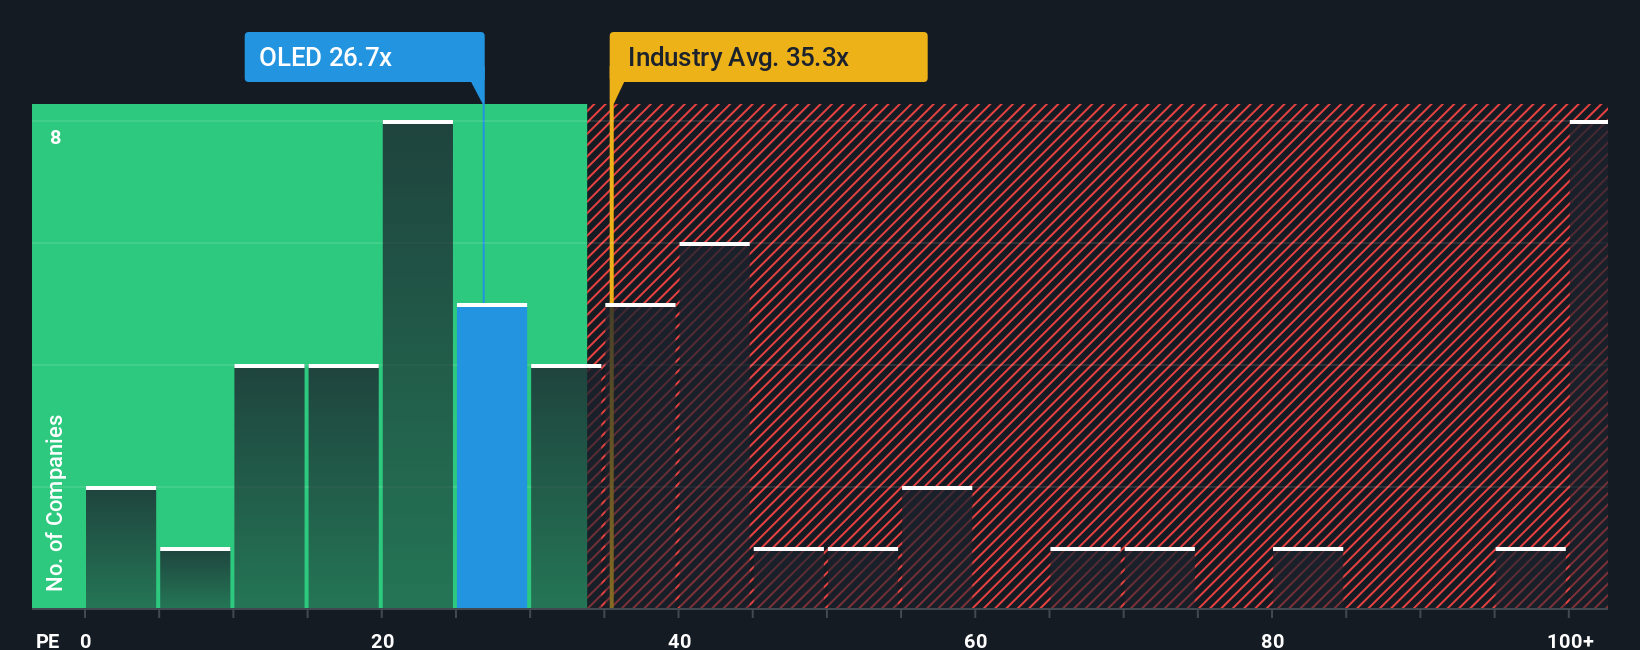
Approach 2: Universal Display Price vs Earnings
For a profitable, relatively mature business like Universal Display, the price to earnings ratio is a practical way to gauge whether investors are paying a reasonable price for each dollar of current profits. In general, faster growing and lower risk companies can justify higher PE ratios, while slower growth or higher uncertainty usually calls for a lower, more conservative multiple.
Universal Display currently trades on a PE of about 26.1x, which is below the broader Semiconductor industry average of roughly 37.5x and also under the peer group average of around 33.2x. At first glance, that discount might suggest some value, but headline comparisons can be misleading because they do not adjust for company specific drivers.
That is where Simply Wall St's Fair Ratio comes in. It is a tailored PE multiple that reflects Universal Display's earnings growth outlook, profitability, risk profile, industry positioning and market cap. Because it blends these fundamentals, it provides a more nuanced yardstick than simple peer or sector averages. For Universal Display, the Fair Ratio is about 23.8x, modestly below the current 26.1x. This implies the shares trade at a small premium to what the fundamentals support rather than a clear bargain.
Result: OVERVALUED
PE ratios tell one story, but what if the real opportunity lies elsewhere? Discover 1443 companies where insiders are betting big on explosive growth.
Upgrade Your Decision Making: Choose your Universal Display Narrative
Earlier we mentioned that there is an even better way to understand valuation, so let us introduce you to Narratives, a simple framework that lets you attach a story, your assumptions about future revenue, earnings and margins, to the numbers you see on Simply Wall St.
A Narrative connects three things: what you believe about a company’s business and industry, how that belief translates into a financial forecast, and the fair value that emerges from those forecasts.
On Simply Wall St’s Community page, used by millions of investors, Narratives make this process accessible by guiding you to set or adjust assumptions, then instantly showing how your fair value compares to the current market price so you can decide whether that story suggests buy, hold, or sell.
Because Narratives update dynamically as fresh news, earnings and guidance arrive, they keep your thesis live and testable rather than something you wrote once and forgot about.
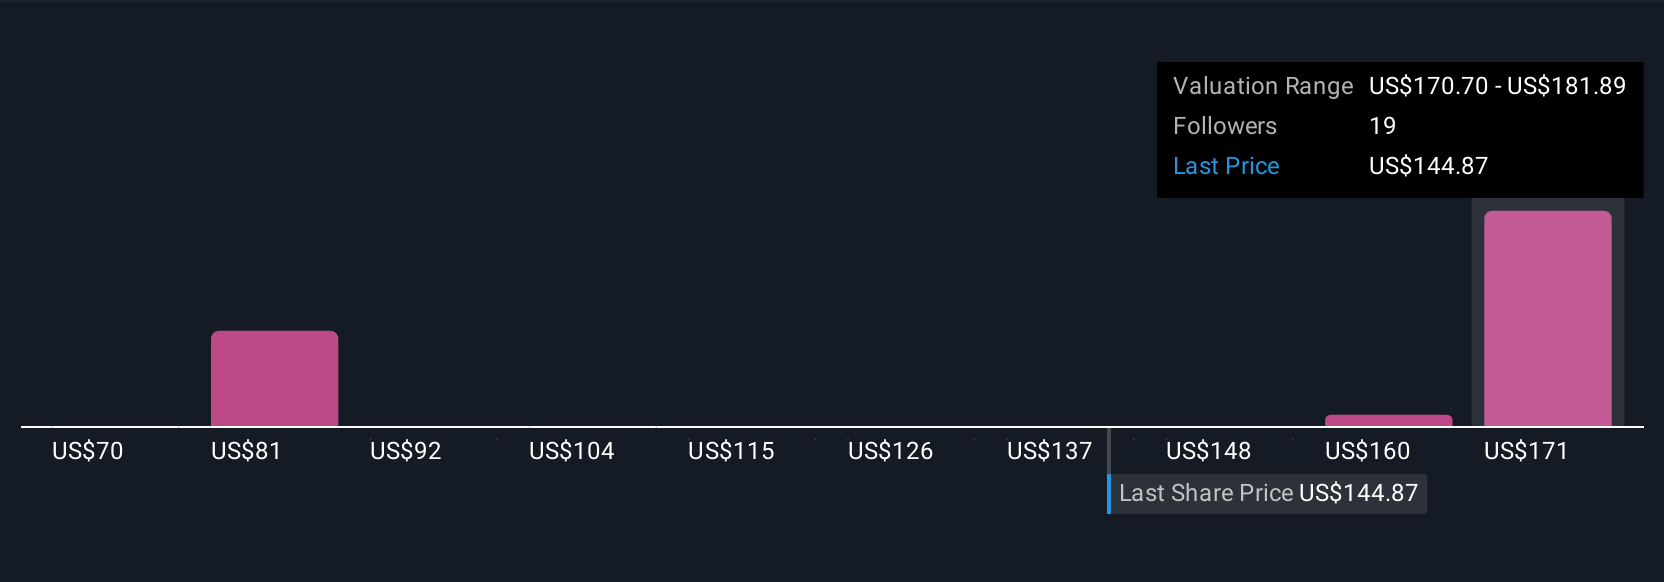
For Universal Display, one investor might build a bullish Narrative that focuses on accelerating OLED adoption and arrive at a fair value closer to $220, while a more cautious investor might emphasize competition and macro risks and land nearer $160. Both investors can clearly see whether the current price makes their story look attractive or stretched.
Do you think there's more to the story for Universal Display? Head over to our Community to see what others are saying!
This article by Simply Wall St is general in nature. We provide commentary based on historical data and analyst forecasts only using an unbiased methodology and our articles are not intended to be financial advice. It does not constitute a recommendation to buy or sell any stock, and does not take account of your objectives, or your financial situation. We aim to bring you long-term focused analysis driven by fundamental data. Note that our analysis may not factor in the latest price-sensitive company announcements or qualitative material. Simply Wall St has no position in any stocks mentioned.
Have feedback on this article? Concerned about the content? Get in touch with us directly. Alternatively, email editorial-team@simplywallst.com