
 Nasdaq
 华尔街日报
华尔街日报Is Equinor a Value Opportunity After Recent Shift Toward Core Oil and Gas Projects?
- Wondering if Equinor is quietly turning into a value opportunity while the headlines focus on flashier energy names? Let us break down whether the current price really reflects what you are getting.
- Over the last week the stock has inched up about 1.5%, but it is still down roughly 3.2% over the last month and 15.5% year to date, adding some tension between short term sentiment and long term positioning.
- Recent news flow has centered on Equinor doubling down on core oil and gas projects while still pushing into lower carbon initiatives, a combination that keeps investors debating how to price its future cash flows. At the same time, ongoing discussions around European energy security and Norway's role as a key supplier keep Equinor in the spotlight whenever commodity markets shift.
- On our framework the stock scores a 5 out of 6 valuation checks, which suggests the market may be underestimating parts of the story. Next we will walk through the main valuation approaches before exploring an even better way to think about what Equinor might really be worth.
Find out why Equinor's -4.3% return over the last year is lagging behind its peers.
Approach 1: Equinor Discounted Cash Flow (DCF) Analysis
A Discounted Cash Flow model estimates what a business is worth by projecting the cash it can generate in the future, then discounting those cash flows back into today’s dollars. For Equinor, the model used is a 2 stage Free Cash Flow to Equity approach, based on cash flows in $.
Equinor generated about $8.96 billion in free cash flow over the last twelve months, and analysts see this remaining robust, with projections stepping down from around $4.73 billion in 2026 before gradually growing again to roughly $7.05 billion by 2035. Analyst estimates only extend a few years, so the later forecasts are extrapolated rather than directly predicted. This adds some uncertainty but still provides a useful long term guide.
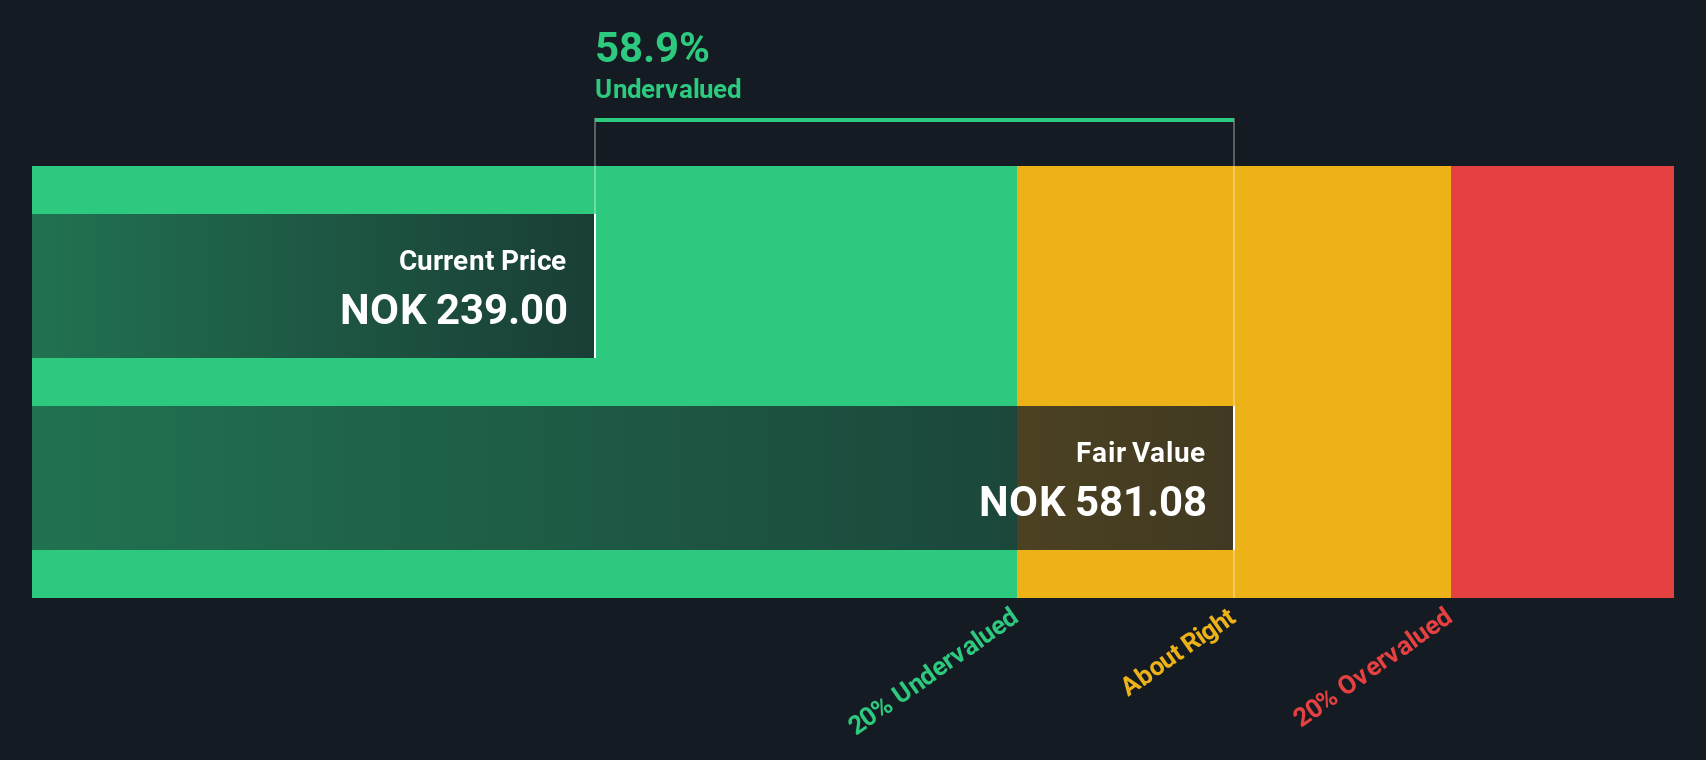
When all those future cash flows are discounted back to today, the DCF framework points to an intrinsic value of roughly $617.57 per share. That implies the stock trades at about a 61.9% discount to this estimate. This suggests the market is pricing in far more risk, or much weaker long term cash flows, than this model does.
Result: UNDERVALUED
Our Discounted Cash Flow (DCF) analysis suggests Equinor is undervalued by 61.9%. Track this in your watchlist or portfolio, or discover 912 more undervalued stocks based on cash flows.
Approach 2: Equinor Price vs Earnings
For profitable companies like Equinor, the price to earnings ratio is a useful yardstick because it links what you pay directly to the profits the business is generating today. Investors usually accept a higher PE when they expect stronger growth or see the earnings stream as safer, while slower growth or higher risk tends to justify a lower, “cheaper” multiple.
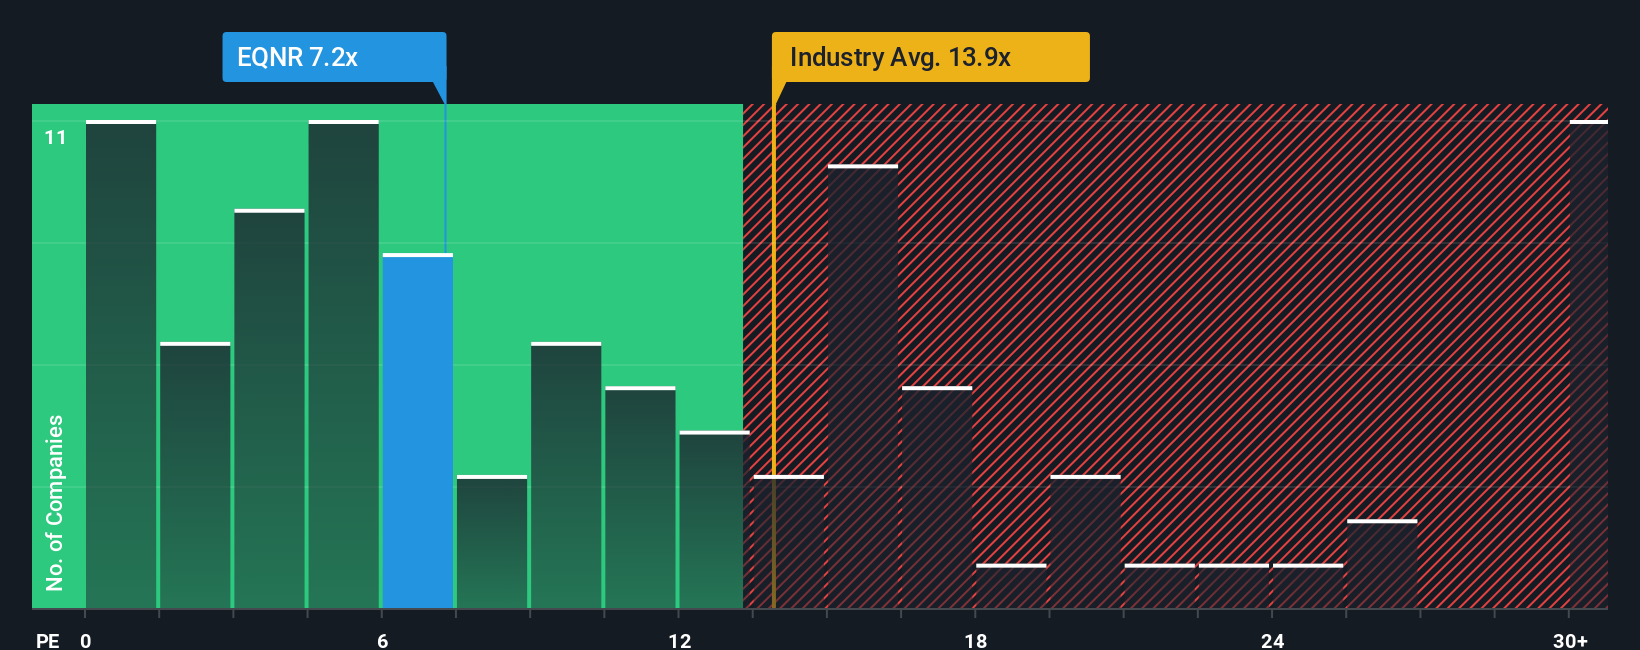
Equinor currently trades on about 10.2x earnings, which is below both the Oil and Gas industry average of roughly 13.7x and the broader peer group at around 16.4x. On the surface, that discount suggests the market is applying a cautious lens to Equinor’s future earnings power compared with other players in the space.
Simply Wall St’s Fair Ratio framework goes a step further by estimating what a reasonable PE should be after factoring in company specific elements such as earnings growth, profitability, industry characteristics, market cap and risk profile. For Equinor, that Fair Ratio sits near 10.3x, almost exactly in line with where the shares trade today. This indicates the current market price is broadly in line with what would be expected once those fundamentals are taken into account.
Result: ABOUT RIGHT
PE ratios tell one story, but what if the real opportunity lies elsewhere? Discover 1442 companies where insiders are betting big on explosive growth.
Upgrade Your Decision Making: Choose your Equinor Narrative
Earlier we mentioned that there is an even better way to understand valuation, so let us introduce you to Narratives, which are simply your story about a company, turned into a set of assumptions about its future revenues, earnings and margins that link into a financial forecast and, ultimately, a fair value estimate you can compare to today’s share price.
On Simply Wall St’s Community page, Narratives are an easy, interactive tool used by millions of investors to spell out why they think a business like Equinor will perform a certain way, translate that view into numbers, and then see whether their Fair Value suggests it might be time to buy, hold or sell.
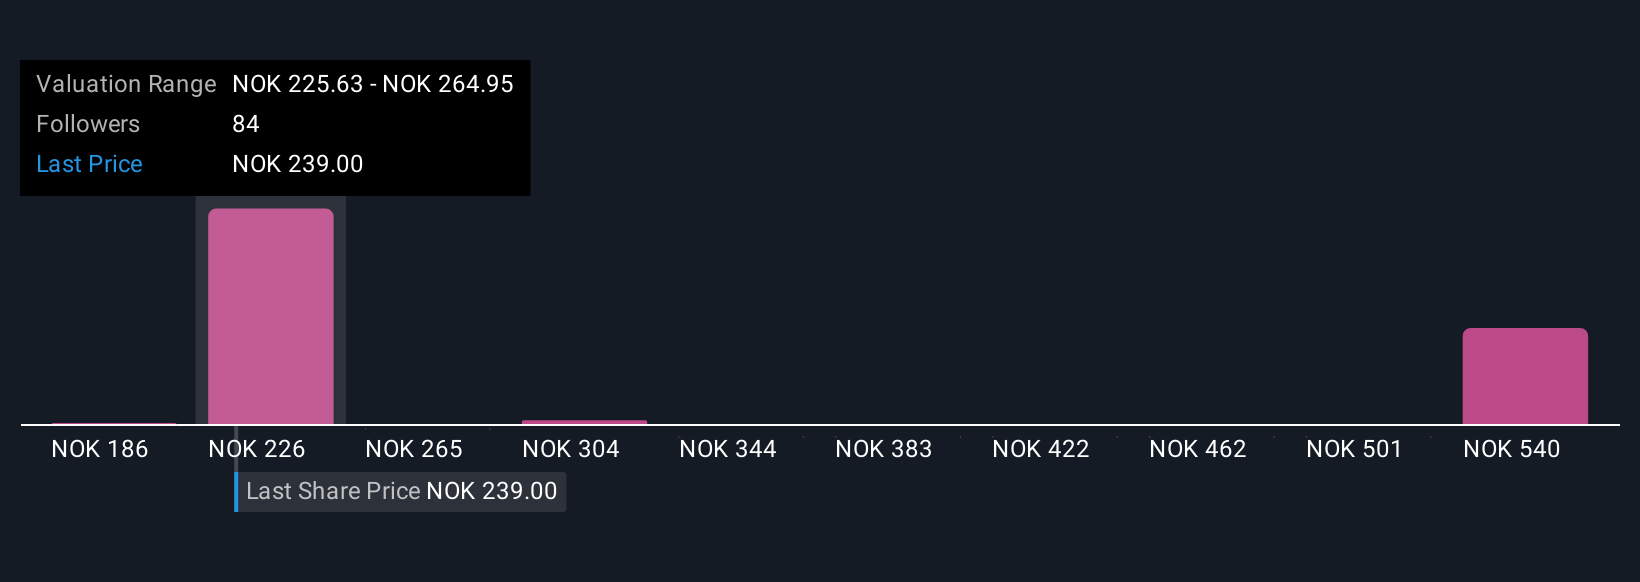
Narratives are also dynamic, automatically updating when fresh data, news or earnings arrive. For example, an investor who focuses on execution risks in renewables and slowing cash returns might reasonably land near the lower end of current Equinor fair values around NOK179. By contrast, a more optimistic investor who believes major projects and energy transition growth will compound value could justify something closer to the upper band near NOK321. Both perspectives are clearly linked back to transparent, updateable assumptions rather than vague hunches.
Do you think there's more to the story for Equinor? Head over to our Community to see what others are saying!
This article by Simply Wall St is general in nature. We provide commentary based on historical data and analyst forecasts only using an unbiased methodology and our articles are not intended to be financial advice. It does not constitute a recommendation to buy or sell any stock, and does not take account of your objectives, or your financial situation. We aim to bring you long-term focused analysis driven by fundamental data. Note that our analysis may not factor in the latest price-sensitive company announcements or qualitative material. Simply Wall St has no position in any stocks mentioned.
Have feedback on this article? Concerned about the content? Get in touch with us directly. Alternatively, email editorial-team@simplywallst.com