
 Nasdaq
 华尔街日报
华尔街日报Has Principal Financial Group’s 111% Five Year Rally Left Much Value on the Table?
- Wondering whether Principal Financial Group is still good value after its long run, or if you would be buying in too late? Let us unpack what the current share price is really implying about future returns.
- The stock has quietly climbed, up 1.3% over the last week, 5.9% over the past month, and 11.0% year to date, adding to a strong 111.1% gain over the last five years that has investors asking whether the easy money has already been made.
- Recent attention around life and retirement insurers has focused on shifting interest rate expectations and how capital return plans might evolve. Both of these feed directly into how markets price long term earnings power and risk. At the same time, sector wide conversations about regulation, capital buffers, and fee based revenue streams are shaping how investors think about the durability of Principal Financial Group's business model.
- On our framework, Principal Financial Group scores a 4 out of 6 on key undervaluation checks, suggesting there is still some value support baked into the current price, but not without caveats. Next we will walk through how different valuation approaches see the stock, and then finish with a more complete way to think about its true worth beyond just the headline multiples.
Approach 1: Principal Financial Group Excess Returns Analysis
The Excess Returns model looks at how much profit Principal Financial Group can generate above the return that shareholders reasonably demand on their equity, then capitalizes those extra profits into an intrinsic value per share.
In this framework, Principal starts from a Book Value base of $52.90 per share, with analysts expecting Stable EPS of $9.21 per share, driven by an Average Return on Equity of 15.80. Against an implied Cost of Equity of $4.05 per share, the company is generating an Excess Return of $5.16 per share, indicating that each dollar of equity is working harder than the required hurdle rate.
Looking ahead, the Stable Book Value is projected to rise to $58.29 per share, based on estimates from 7 analysts. This supports the idea that these excess returns can be sustained rather than being a short term spike.
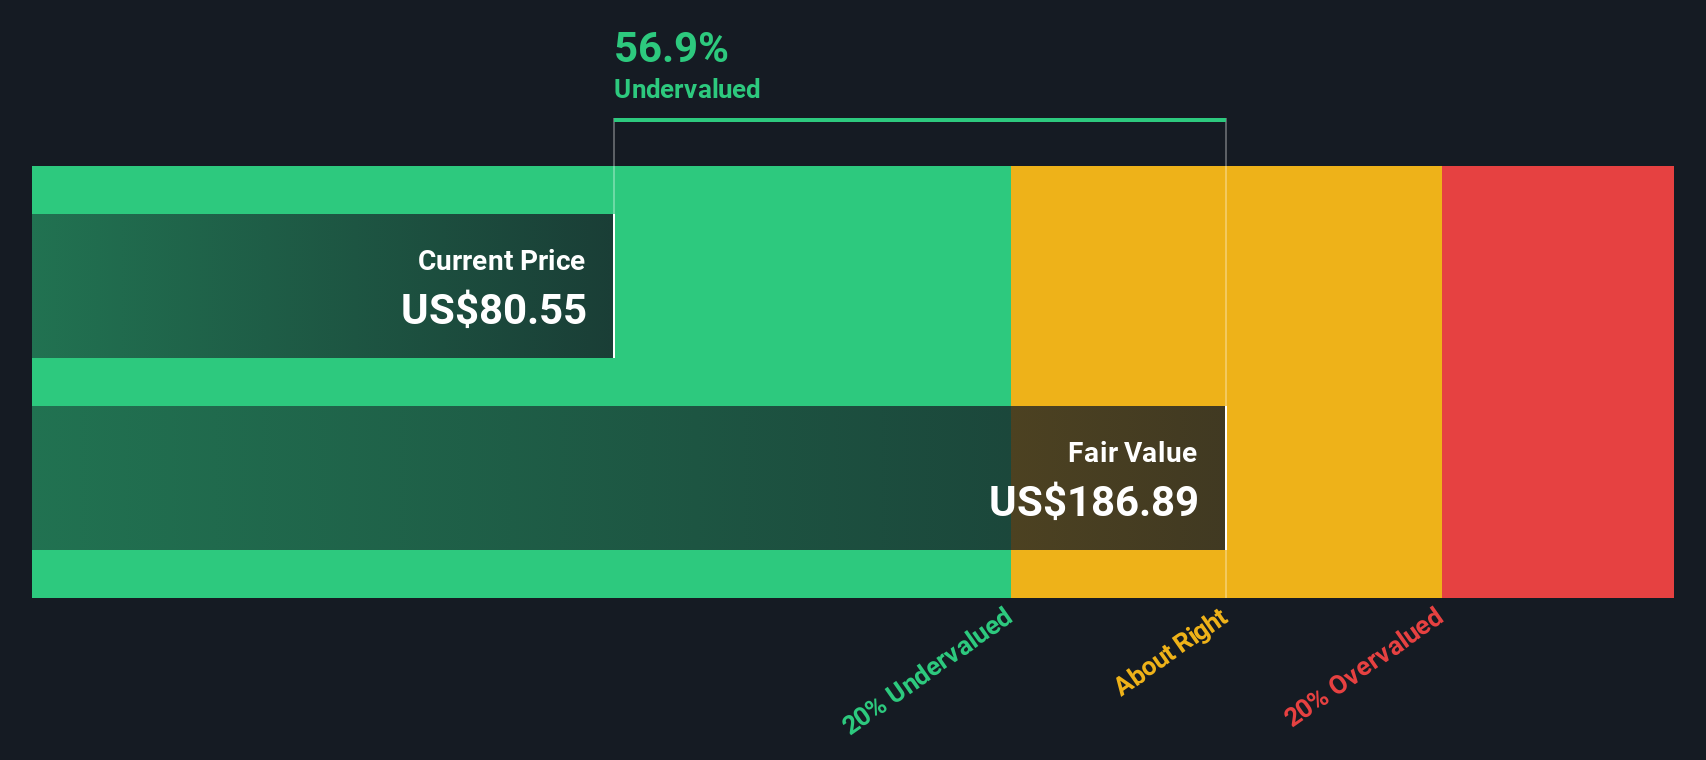
When these excess profits are projected and discounted, the model arrives at an intrinsic value that implies the stock is 56.6% undervalued relative to its current market price.
Result: UNDERVALUED
Our Excess Returns analysis suggests Principal Financial Group is undervalued by 56.6%. Track this in your watchlist or portfolio, or discover 912 more undervalued stocks based on cash flows.
Approach 2: Principal Financial Group Price vs Earnings
For consistently profitable businesses like Principal Financial Group, the price to earnings multiple is a useful shorthand for what investors are willing to pay for each dollar of current earnings. It naturally blends expectations about future growth with the level of risk investors perceive in those earnings, so higher growth and lower risk typically justify a higher normal PE ratio, while slower or more volatile earnings usually command a discount.
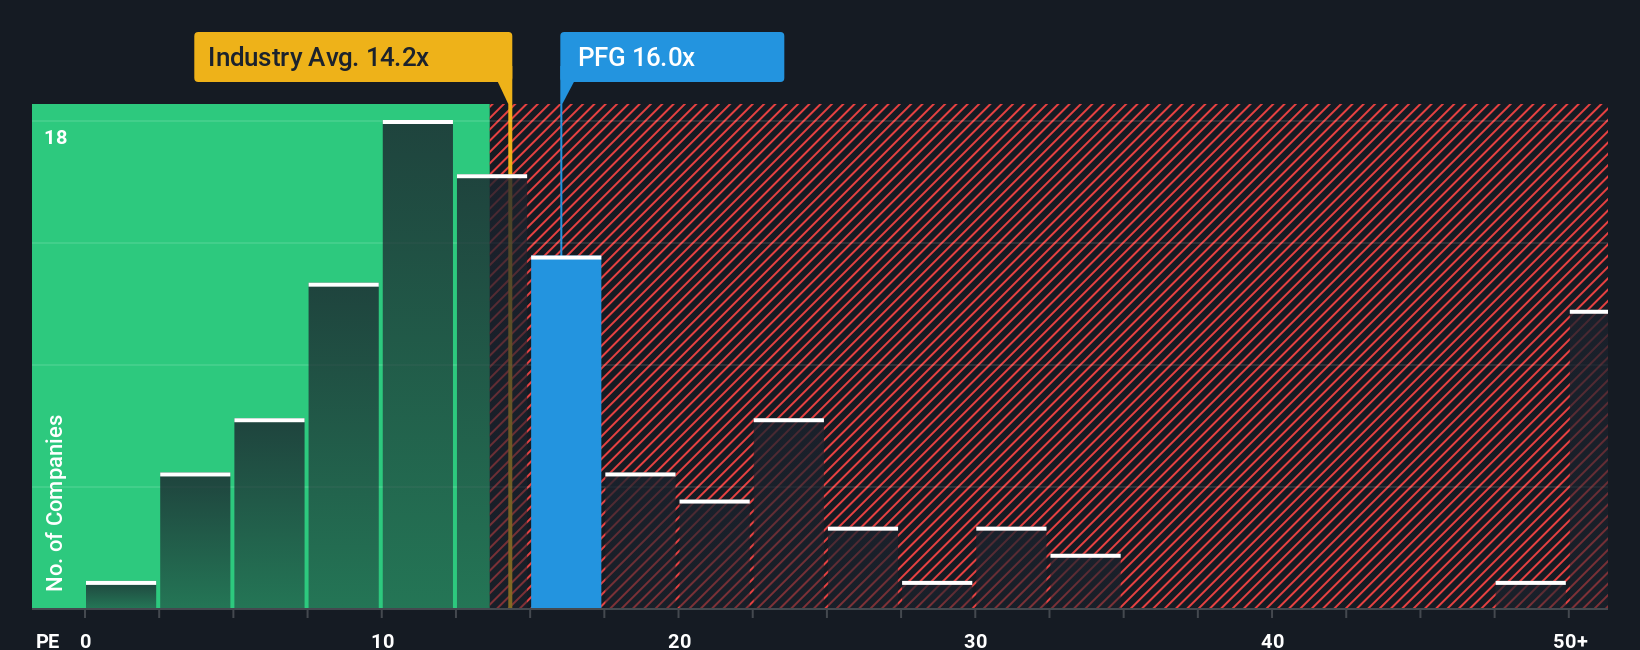
Principal currently trades on a PE of roughly 12.0x, which is slightly below both the wider Insurance industry average of about 12.8x and the peer group average of around 10.4x. Simply Wall St also calculates a Fair Ratio of 17.0x for Principal, which is the PE level you might expect when you factor in the company’s specific earnings growth outlook, profitability, size, industry context, and risk profile. This Fair Ratio framework is more tailored than a simple peer or sector comparison, because it adjusts for company specific strengths and weaknesses rather than assuming all insurers deserve the same multiple. With the shares trading at 12.0x versus a Fair Ratio of 17.0x, the stock screens as undervalued on this metric.
Result: UNDERVALUED
PE ratios tell one story, but what if the real opportunity lies elsewhere? Discover 1442 companies where insiders are betting big on explosive growth.
Upgrade Your Decision Making: Choose your Principal Financial Group Narrative
Earlier we mentioned that there is an even better way to understand valuation. Let us introduce you to Narratives, which are simple stories investors create on Simply Wall St’s Community page. These Narratives link an investor’s view of a company’s future revenue, earnings, and margins to a financial forecast and a fair value. Investors then compare that fair value to the current price to decide whether to buy or sell. Each Narrative updates dynamically as new information, such as earnings or sector news, comes in.
For example, one Principal Financial Group investor might build a bullish Narrative around robust retirement demand, margin expansion toward roughly 12 percent, and a fair value closer to the upper analyst target near 101 dollars. A more cautious investor might emphasize fee pressure, softer flows, and a fair value around the low end of recent targets near 72 dollars. Both perspectives sit side by side on the platform so you can quickly see which story, and which price versus value gap, makes the most sense to you.
Do you think there's more to the story for Principal Financial Group? Head over to our Community to see what others are saying!

This article by Simply Wall St is general in nature. We provide commentary based on historical data and analyst forecasts only using an unbiased methodology and our articles are not intended to be financial advice. It does not constitute a recommendation to buy or sell any stock, and does not take account of your objectives, or your financial situation. We aim to bring you long-term focused analysis driven by fundamental data. Note that our analysis may not factor in the latest price-sensitive company announcements or qualitative material. Simply Wall St has no position in any stocks mentioned.
Have feedback on this article? Concerned about the content? Get in touch with us directly. Alternatively, email editorial-team@simplywallst.com