
 Nasdaq
 华尔街日报
华尔街日报Does DocuSign’s Mixed Valuation Signal a Second Chance After Recent Share Price Rebound?
- If you are wondering whether DocuSign is quietly setting up for a comeback or if the easy money has already been made, this breakdown is for you.
- The stock has clawed back some ground recently, up 3.2% over the last week and roughly flat over the past month. It is still down 21.3% year to date and 15.0% over the last year, even after a 62.5% gain over three years.
- Behind those choppy returns, investors are still digesting DocuSign's evolution from a high growth pandemic winner to a more mature e-signature and agreement management platform, as the market reassesses what sustainable growth and margins really look like. At the same time, ongoing product upgrades and a renewed focus on enterprise customers have kept the story interesting for anyone watching long term adoption trends.
- Based on our checks, the stock scores a 3/6 valuation score, suggesting it screens as undervalued on only half of our metrics. In this breakdown we will unpack what different valuation approaches are really saying about DocuSign, then finish with an additional way to think about its true worth.
Find out why DocuSign's -15.0% return over the last year is lagging behind its peers.
Approach 1: DocuSign Discounted Cash Flow (DCF) Analysis
A Discounted Cash Flow model estimates what a business is worth by projecting the cash it can generate in the future and discounting those cash flows back to today in dollar terms. For DocuSign, the 2 Stage Free Cash Flow to Equity model starts with last twelve months free cash flow of about $938 million, then applies analyst forecasts and longer term extrapolations.
Analysts expect free cash flow to rise to roughly $1.19 billion by 2030, with interim projections in the high hundreds of millions over the next decade as growth gradually slows from earlier, faster years. Simply Wall St uses analyst estimates where available, then extends the trend to build a full 10 year cash flow path before applying a discount rate to reflect risk and the time value of money.
On this basis, the model arrives at an intrinsic value of about $100.70 per share, implying DocuSign is trading at a 29.4% discount to its estimated worth. In other words, the current share price suggests a meaningful margin of safety if these cash flow assumptions hold.
Result: UNDERVALUED
Our Discounted Cash Flow (DCF) analysis suggests DocuSign is undervalued by 29.4%. Track this in your watchlist or portfolio, or discover 913 more undervalued stocks based on cash flows.

Approach 2: DocuSign Price vs Earnings
For consistently profitable software businesses like DocuSign, the price to earnings ratio is a useful way to gauge how much investors are paying for each dollar of current earnings. In general, higher growth and lower risk justify a higher PE multiple, while slower growth or greater uncertainty usually pull that “normal” or “fair” PE down.
DocuSign currently trades on about 50.9x earnings, which is richer than both the broader Software industry at roughly 31.4x and its closer peer group at around 45.9x. Simply Wall St’s proprietary Fair Ratio framework goes a step further by estimating what PE the company should reasonably command based on its earnings growth outlook, profitability, industry, market cap and specific risk profile.
On this basis, DocuSign’s Fair Ratio comes out to about 34.0x, well below the current 50.9x. That gap suggests investors are already baking in more growth or less risk than the fundamentals currently support, even after accounting for sector dynamics and company scale.
Result: OVERVALUED

PE ratios tell one story, but what if the real opportunity lies elsewhere? Discover 1442 companies where insiders are betting big on explosive growth.
Upgrade Your Decision Making: Choose your DocuSign Narrative
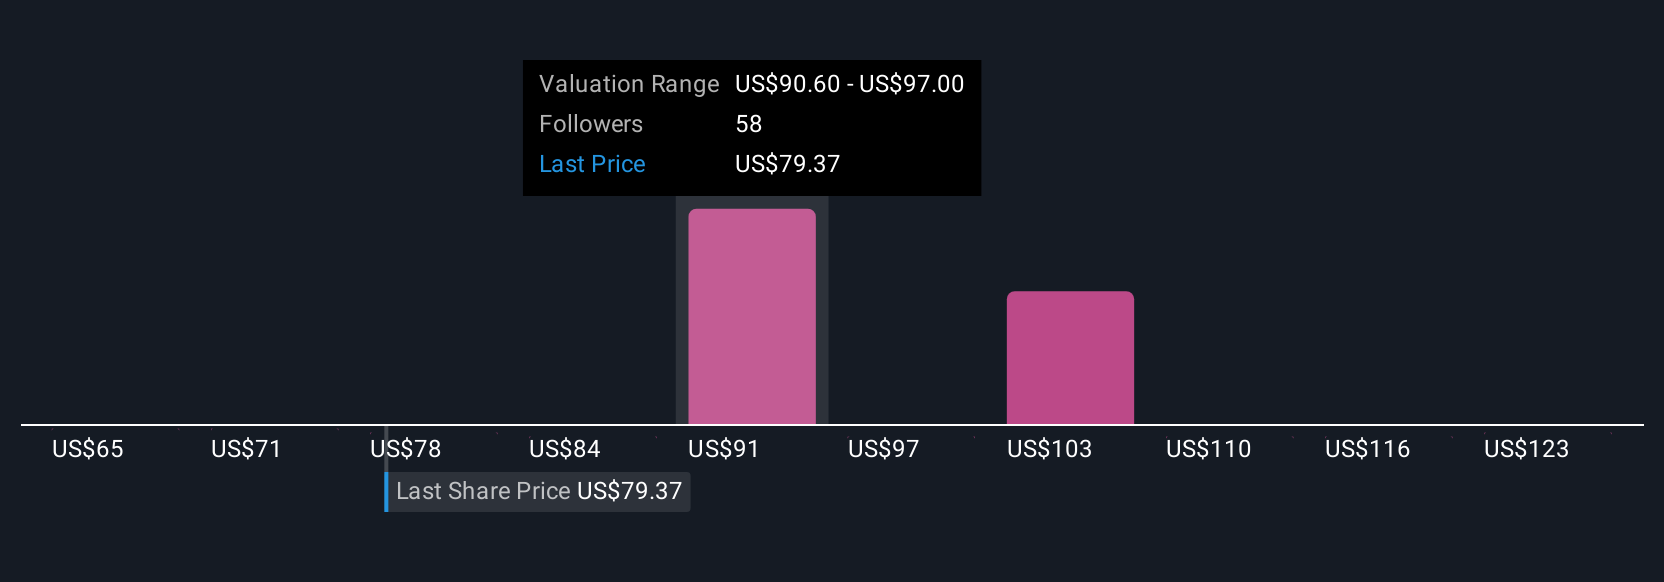
Earlier we mentioned that there is an even better way to understand valuation, so let us introduce you to Narratives, a simple framework on Simply Wall St’s Community page that lets you spell out your story for DocuSign, translate that into assumptions for future revenue, earnings and margins, and from there into a personal fair value you can compare to today’s share price when deciding whether to buy, hold or sell. Rather than relying only on static ratios, a Narrative ties what you believe about DocuSign’s AI powered agreement platform, international expansion, competitive threats and margin trajectory to a live financial forecast that is automatically refreshed as new earnings, guidance or news arrive, so your fair value updates with reality instead of going stale. For example, one investor on the platform might build a narrative that aligns with their own higher fair value near $124 per share, based on a view that AI native IAM adoption and international growth will drive faster revenue and EPS gains. In contrast, a more cautious investor might anchor closer to $77, assuming slower uptake, tougher competition and more persistent margin pressure. Narratives makes both perspectives transparent, comparable and easy to revisit over time.
Do you think there's more to the story for DocuSign? Head over to our Community to see what others are saying!
This article by Simply Wall St is general in nature. We provide commentary based on historical data and analyst forecasts only using an unbiased methodology and our articles are not intended to be financial advice. It does not constitute a recommendation to buy or sell any stock, and does not take account of your objectives, or your financial situation. We aim to bring you long-term focused analysis driven by fundamental data. Note that our analysis may not factor in the latest price-sensitive company announcements or qualitative material. Simply Wall St has no position in any stocks mentioned.
Have feedback on this article? Concerned about the content? Get in touch with us directly. Alternatively, email editorial-team@simplywallst.com