
 Nasdaq
 华尔街日报
华尔街日报3 European Dividend Stocks With Up To 7.1% Yield For Your Portfolio
As European markets continue to show resilience, with the pan-European STOXX Europe 600 Index closing 2.35% higher and major single-country indexes also rising, investors are increasingly looking towards dividend stocks as a potential source of steady income amidst economic fluctuations. In this environment, a good dividend stock is often characterized by its ability to provide consistent payouts and maintain stability even when broader market conditions are unpredictable.
Top 10 Dividend Stocks In Europe
| Name | Dividend Yield | Dividend Rating |
| Zurich Insurance Group (SWX:ZURN) | 4.34% | ★★★★★★ |
| Telekom Austria (WBAG:TKA) | 4.65% | ★★★★★★ |
| Holcim (SWX:HOLN) | 4.12% | ★★★★★★ |
| HEXPOL (OM:HPOL B) | 4.74% | ★★★★★★ |
| freenet (XTRA:FNTN) | 6.55% | ★★★★★☆ |
| Evolution (OM:EVO) | 4.94% | ★★★★★★ |
| DKSH Holding (SWX:DKSH) | 4.16% | ★★★★★★ |
| Credito Emiliano (BIT:CE) | 5.17% | ★★★★★☆ |
| Cembra Money Bank (SWX:CMBN) | 4.37% | ★★★★★★ |
| Bravida Holding (OM:BRAV) | 4.52% | ★★★★★★ |
Click here to see the full list of 207 stocks from our Top European Dividend Stocks screener.
Let's take a closer look at a couple of our picks from the screened companies.
Valsoia (BIT:VLS)
Simply Wall St Dividend Rating: ★★★★☆☆
Overview: Valsoia S.p.A. is an Italian company that offers plant-based and healthy food products both domestically and internationally, with a market cap of €119.09 million.
Operations: Valsoia S.p.A. generates revenue primarily from its Healthy Food Products segment, which accounts for €118.11 million.
Dividend Yield: 3.4%
Valsoia's dividend payments have been reliable and growing over the past decade, though the 3.44% yield is below Italy's top quartile. Despite a low earnings payout ratio of 48.8%, high cash payout at 212.6% raises sustainability concerns, as dividends aren't well covered by free cash flow. Recent earnings show modest growth with net income rising to €4.23 million for H1 2025, yet share buybacks remain minimal at €0.08 million for a small stake repurchase.
- Navigate through the intricacies of Valsoia with our comprehensive dividend report here.
- In light of our recent valuation report, it seems possible that Valsoia is trading behind its estimated value.

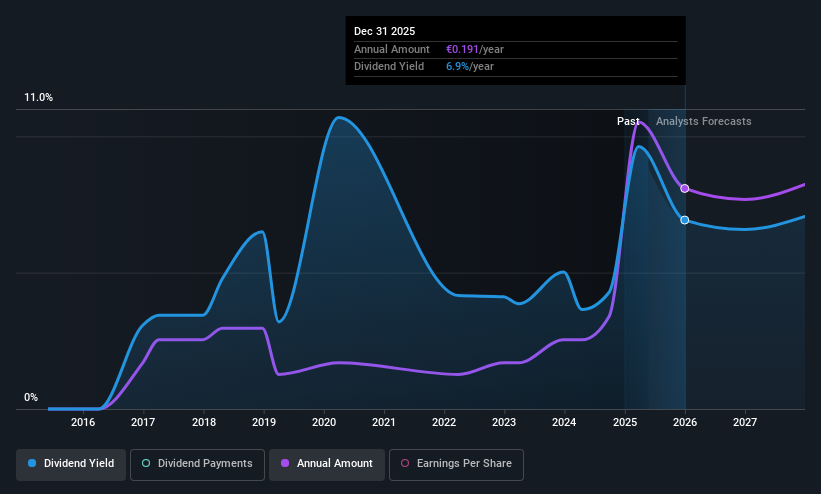
Banco de Sabadell (BME:SAB)
Simply Wall St Dividend Rating: ★★★★☆☆
Overview: Banco de Sabadell, S.A. offers a range of banking products and services to personal, business, and private customers both in Spain and internationally, with a market cap of €16.43 billion.
Operations: Banco de Sabadell's revenue segments include €0.18 billion from its Banking Business in Mexico, €1.30 billion from the United Kingdom, and €4.28 billion from Spain, which also encompasses its Real Estate Asset Transformation Business.
Dividend Yield: 5.9%
Banco de Sabadell's dividend yield is among the top 25% in Spain, supported by a low payout ratio of 31.3%, indicating strong coverage by earnings. However, its dividends have been volatile over the past nine years and are considered unreliable. The bank's earnings grew by 27.8% last year but are forecast to decline annually by 3.2% over the next three years, raising concerns about future dividend sustainability despite trading below estimated fair value. Recent takeover attempts by BBVA were rejected, highlighting potential undervaluation issues and impacting share stability.
- Take a closer look at Banco de Sabadell's potential here in our dividend report.
- The valuation report we've compiled suggests that Banco de Sabadell's current price could be quite moderate.
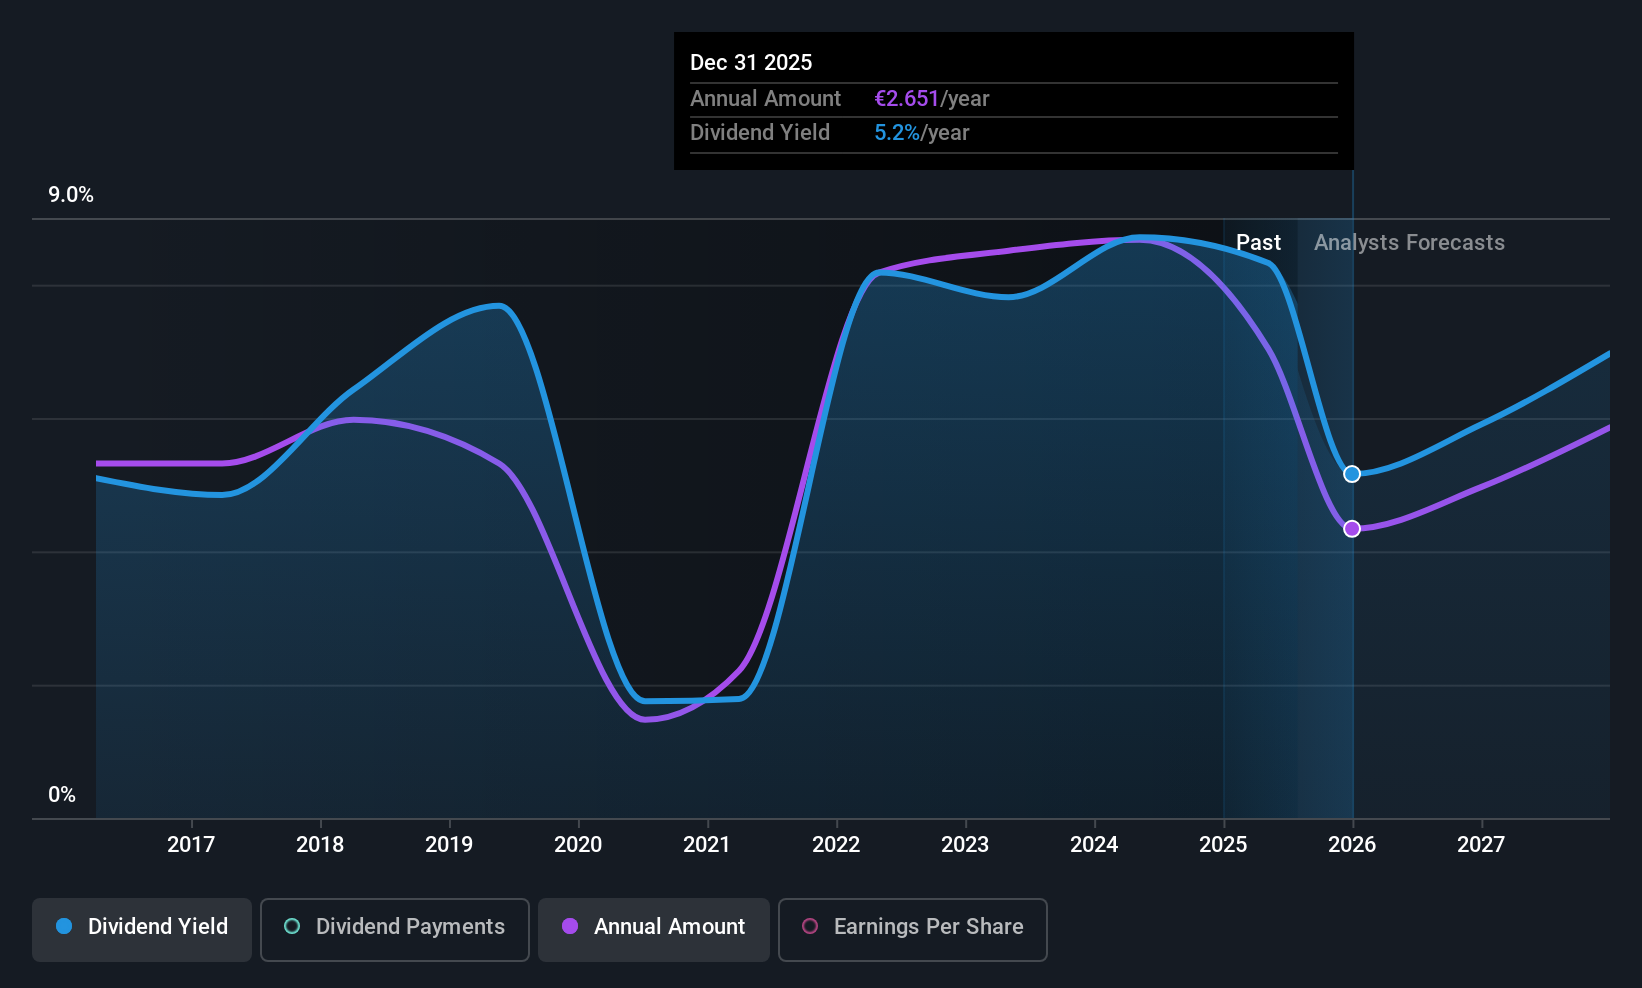
Mercedes-Benz Group (XTRA:MBG)
Simply Wall St Dividend Rating: ★★★★★☆
Overview: Mercedes-Benz Group AG operates as an automotive company both in Germany and internationally, with a market cap of approximately €57.95 billion.
Operations: Mercedes-Benz Group AG generates its revenue through three main segments: Mercedes-Benz Cars (€101.42 billion), Mercedes-Benz Vans (€17.36 billion), and Mercedes-Benz Mobility (€24.35 billion).
Dividend Yield: 7.1%
Mercedes-Benz Group's dividend yield is in the top 25% of German payers, supported by a payout ratio of 66.3% and strong cash flow coverage at 34.5%. Despite this, its dividends have been volatile over the past decade, impacting reliability perceptions. Recent earnings showed a decline with Q3 net income at €1.17 billion compared to €1.73 billion last year, highlighting potential challenges for future dividend sustainability amidst high debt levels and strategic leadership changes effective December 2025.
- Click to explore a detailed breakdown of our findings in Mercedes-Benz Group's dividend report.
- Upon reviewing our latest valuation report, Mercedes-Benz Group's share price might be too pessimistic.
Next Steps
- Access the full spectrum of 207 Top European Dividend Stocks by clicking on this link.
- Already own these companies? Link your portfolio to Simply Wall St and get alerts on any new warning signs to your stocks.
- Elevate your portfolio with Simply Wall St, the ultimate app for investors seeking global market coverage.
Interested In Other Possibilities?
- Explore high-performing small cap companies that haven't yet garnered significant analyst attention.
- Fuel your portfolio with companies showing strong growth potential, backed by optimistic outlooks both from analysts and management.
- Find companies with promising cash flow potential yet trading below their fair value.
This article by Simply Wall St is general in nature. We provide commentary based on historical data and analyst forecasts only using an unbiased methodology and our articles are not intended to be financial advice. It does not constitute a recommendation to buy or sell any stock, and does not take account of your objectives, or your financial situation. We aim to bring you long-term focused analysis driven by fundamental data. Note that our analysis may not factor in the latest price-sensitive company announcements or qualitative material. Simply Wall St has no position in any stocks mentioned.
Have feedback on this article? Concerned about the content? Get in touch with us directly. Alternatively, email editorial-team@simplywallst.com