
 Nasdaq
 华尔街日报
华尔街日报Is Waste Connections Stock Still Attractive After Recent Pullback And Strong Long Term Gains?
- Wondering if Waste Connections at around $173 a share is quietly setting up a long term value opportunity, or if the easy money has already been made? This breakdown is designed to give you a clear, valuation focused answer.
- The stock has slipped 2.1% over the last week but is still up 2.7% over 30 days and 2.0% year to date. Longer horizons show a much stronger compounding story, with gains of 26.0% over 3 years and 76.2% over 5 years, despite being down 8.3% over the last year.
- Recent trading has been shaped by ongoing investor interest in stable, cash generative waste and recycling businesses as a defensive way to navigate macro uncertainty, with Waste Connections often highlighted for its recurring revenue profile and acquisitive growth strategy. At the same time, headlines around environmental infrastructure spending and local government contracting have kept expectations elevated for operators seen as capable of winning and integrating new routes efficiently.
- On our numbers, Waste Connections only passes 1 of 6 undervaluation checks, giving it a valuation score of 1/6. We will walk through DCF, multiples and cash flow based approaches next, before finishing with a more nuanced way to think about what this valuation implies for long term investors.
Waste Connections scores just 1/6 on our valuation checks. See what other red flags we found in the full valuation breakdown.
Approach 1: Waste Connections Discounted Cash Flow (DCF) Analysis
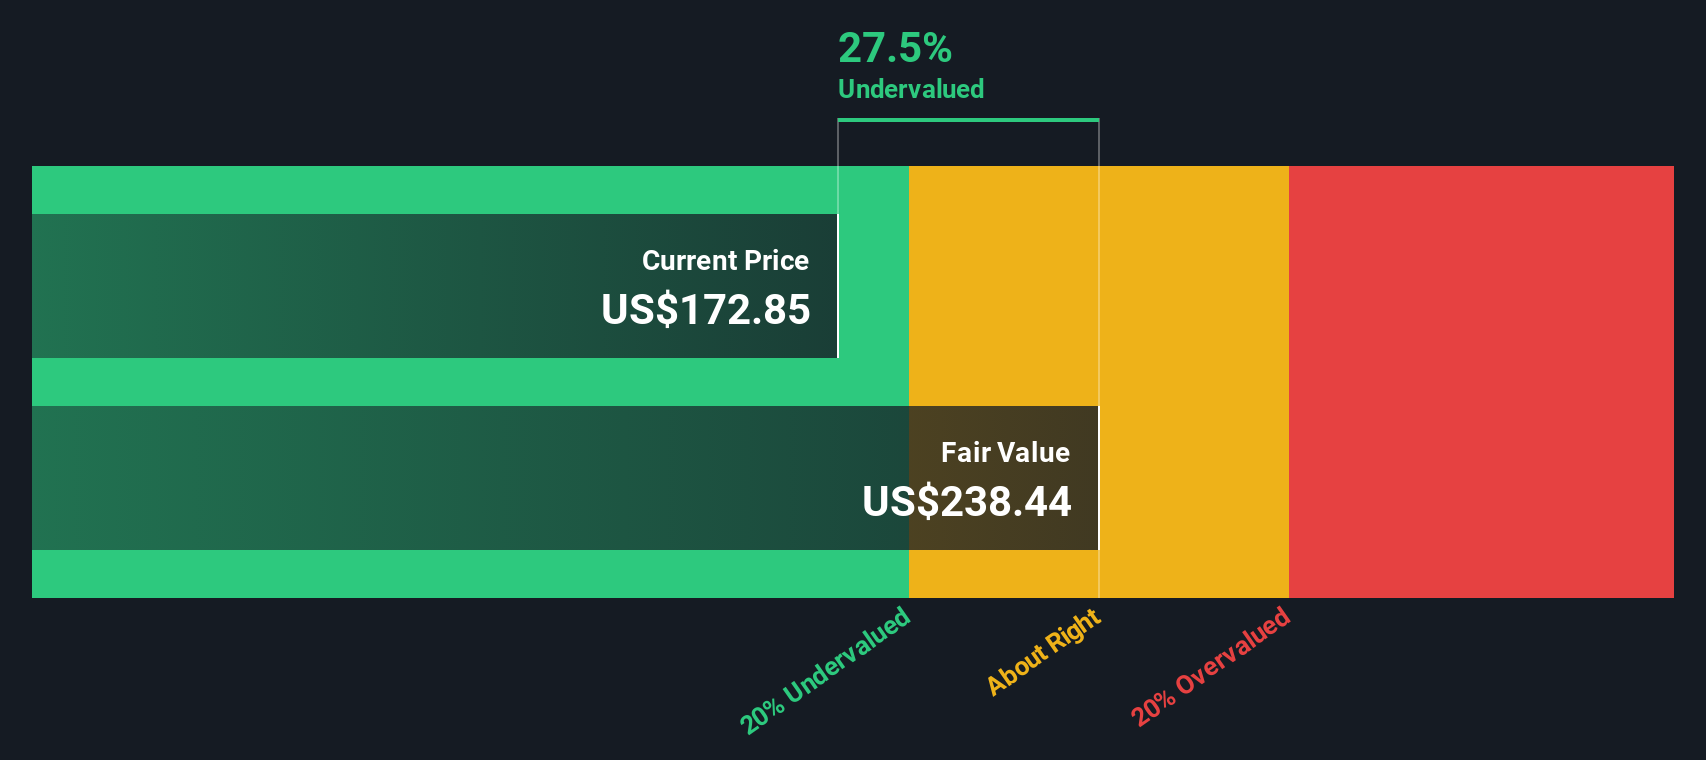
A Discounted Cash Flow model estimates what a business is worth by projecting the cash it can generate in the future and discounting those cash flows back into todays dollars. For Waste Connections, the model starts with last twelve months free cash flow of about $1.31 billion and uses analyst forecasts for the next several years, then extends those trends further out using Simply Wall St assumptions.
On this basis, free cash flow is projected to rise to roughly $2.48 billion by 2035 as the company continues to grow its route density and pricing, with cash flows gradually compounding over time. Those future cash flows are discounted back to arrive at an intrinsic value estimate of about $198.63 per share using a 2 stage Free Cash Flow to Equity framework.
With the stock recently trading around $173, the DCF output indicates Waste Connections is valued below this intrinsic value estimate by about 12.8%. This difference suggests a potential margin of safety for investors who place more weight on the cash flow trajectory than on short term earnings fluctuations.
Result: UNDERVALUED
Our Discounted Cash Flow (DCF) analysis suggests Waste Connections is undervalued by 12.8%. Track this in your watchlist or portfolio, or discover 909 more undervalued stocks based on cash flows.
Approach 2: Waste Connections Price vs Earnings
For profitable, mature businesses like Waste Connections, the price to earnings ratio is a practical way to judge valuation because it directly links what investors pay to the profits the company generates today.
In general, faster growing and lower risk companies tend to trade on higher PE multiples, while slower growth or higher uncertainty can pull that multiple down. Waste Connections currently trades on about 71.29x earnings, well above the Commercial Services industry average of roughly 23.02x and above the average of its listed peers at about 37.38x. This suggests that the market is already pricing in strong durability and growth.
Simply Wall St uses a “Fair Ratio” framework, which estimates what PE multiple a stock might attract given its earnings growth outlook, profitability, industry, market cap and risk profile. This can be more informative than a simple peer or sector comparison because it adjusts for the specific strengths and risk factors of Waste Connections rather than assuming all operators deserve the same multiple. On this basis, Waste Connections Fair Ratio is about 35.48x, which is materially below the current 71.29x. On an earnings multiple basis, the stock therefore screens as expensive.
Result: OVERVALUED
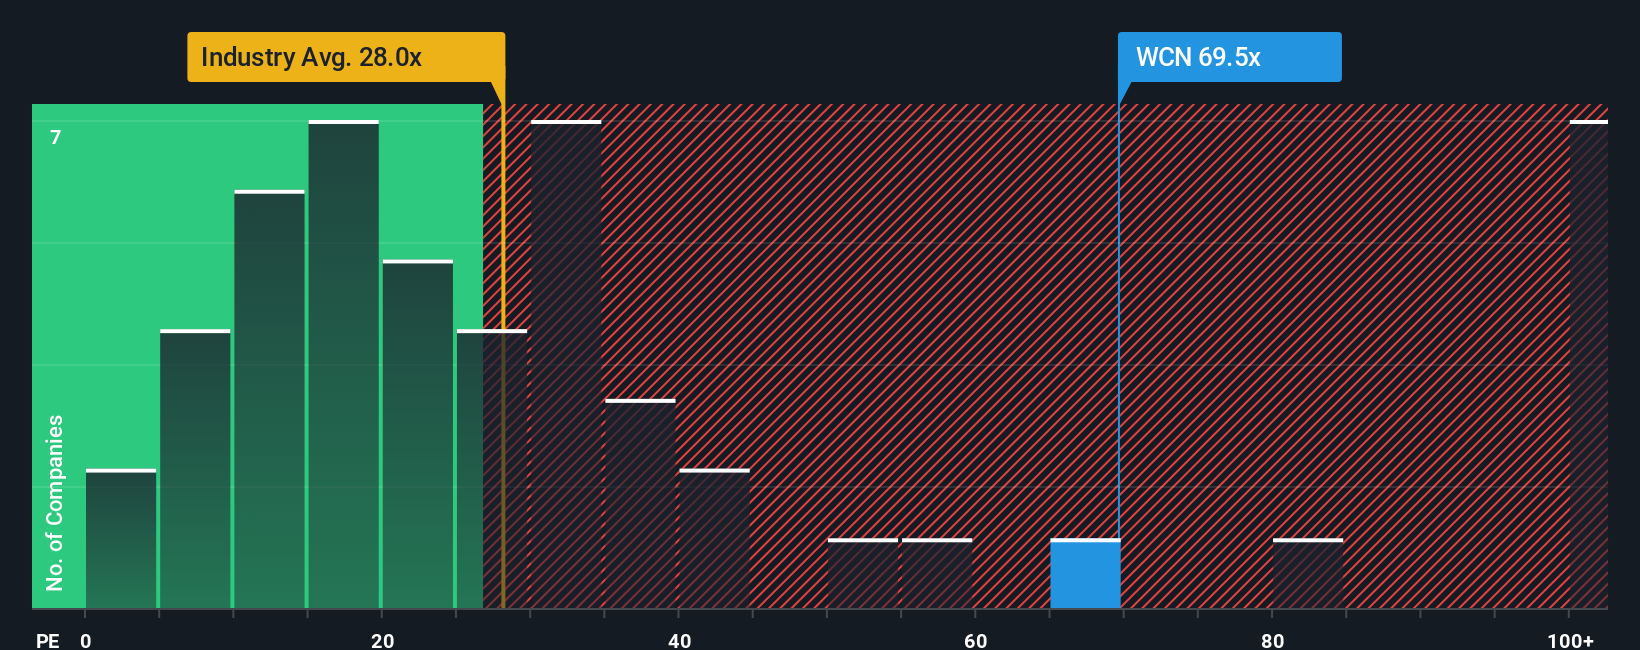
PE ratios tell one story, but what if the real opportunity lies elsewhere? Discover 1442 companies where insiders are betting big on explosive growth.
Upgrade Your Decision Making: Choose your Waste Connections Narrative
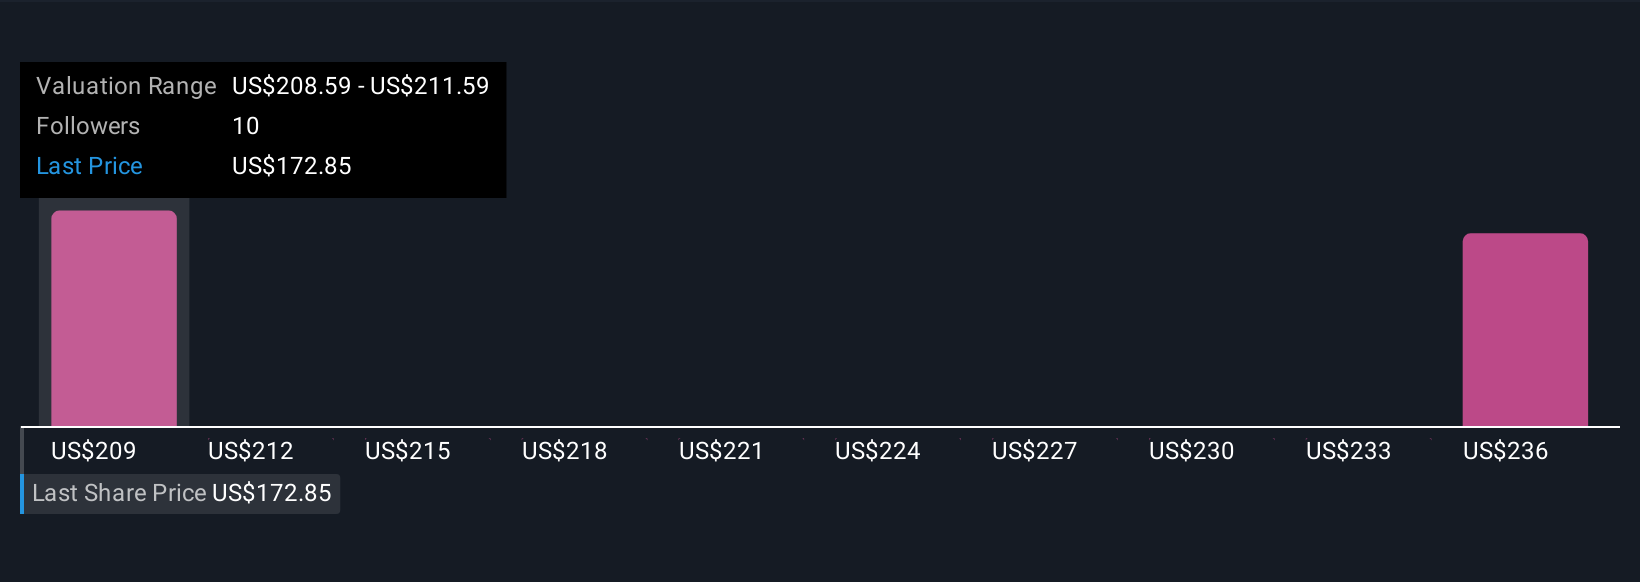
Earlier we mentioned that there is an even better way to understand valuation, so let us introduce you to Narratives. This is a simple way to connect your view of Waste Connections business story with the numbers you care about. It turns your assumptions for future revenue, earnings and margins into a financial forecast, links that forecast to a Fair Value, and then compares it to today’s price to help you think about whether to buy, hold or sell. All of this happens inside an easy to use tool on Simply Wall St’s Community page that automatically updates when new news or earnings arrive. For example, one Waste Connections Narrative might assume strong acquisition driven margin expansion and support a Fair Value near the more bullish analyst target of about $227. A more cautious Narrative, focused on weather, commodity and integration risks, might anchor closer to the bearish $150. This shows you in one place how different perspectives on the same company story can justify very different valuations and helps you quickly see which Narrative, and which implied Fair Value versus price gap, best matches your own conviction and risk tolerance.
Do you think there's more to the story for Waste Connections? Head over to our Community to see what others are saying!
This article by Simply Wall St is general in nature. We provide commentary based on historical data and analyst forecasts only using an unbiased methodology and our articles are not intended to be financial advice. It does not constitute a recommendation to buy or sell any stock, and does not take account of your objectives, or your financial situation. We aim to bring you long-term focused analysis driven by fundamental data. Note that our analysis may not factor in the latest price-sensitive company announcements or qualitative material. Simply Wall St has no position in any stocks mentioned.
Have feedback on this article? Concerned about the content? Get in touch with us directly. Alternatively, email editorial-team@simplywallst.com