
 Nasdaq
 华尔街日报
华尔街日报Is Mastercard Still Attractive After Digital Payments Expansion and Strong Five Year Share Gains?
- Wondering whether Mastercard at around $553 a share is still attractive or already priced for perfection, this breakdown is designed to help you figure out what you are really paying for.
- The stock has inched up about 1.6% over the last week and 1.8% over the past month, adding to a solid 6.0% year to date and roughly 69.1% over five years. This suggests the market still sees Mastercard as a long term compounder.
- Recent headlines have focused on Mastercard expanding its partnerships in digital payments and strengthening its position in cross border transactions. This reinforces the narrative that it is a backbone of global commerce rather than just a credit card brand. At the same time, regulatory discussions around fees and ongoing competition in fintech keep investors debating how much future growth is already reflected in today’s price.
- Despite all that optimism, Mastercard only scores 1/6 on our valuation checks, which means most traditional metrics see it as richly valued rather than a bargain. We will walk through the main valuation approaches next and then finish with a more practical way to think about what the stock is truly worth to you.
Mastercard scores just 1/6 on our valuation checks. See what other red flags we found in the full valuation breakdown.
Approach 1: Mastercard Excess Returns Analysis
The Excess Returns model estimates what Mastercard is worth by comparing how efficiently it turns shareholder capital into profits versus the return investors demand. In simple terms, it looks at how much value Mastercard creates over and above its cost of equity.
Mastercard has a modest Book Value of $8.78 per share, but is expected to generate stable earnings of $26.76 per share, based on weighted future Return on Equity estimates from 12 analysts. With an Average Return on Equity of about 210.29% and a Cost of Equity of just $0.94 per share, the Excess Return works out to a striking $25.82 per share, showing that each dollar of equity is being leveraged extremely efficiently.
The Stable Book Value is projected to rise to $12.73 per share, supported by estimates from 8 analysts. This suggests that Mastercard can keep compounding its equity base while still earning very high returns on it.
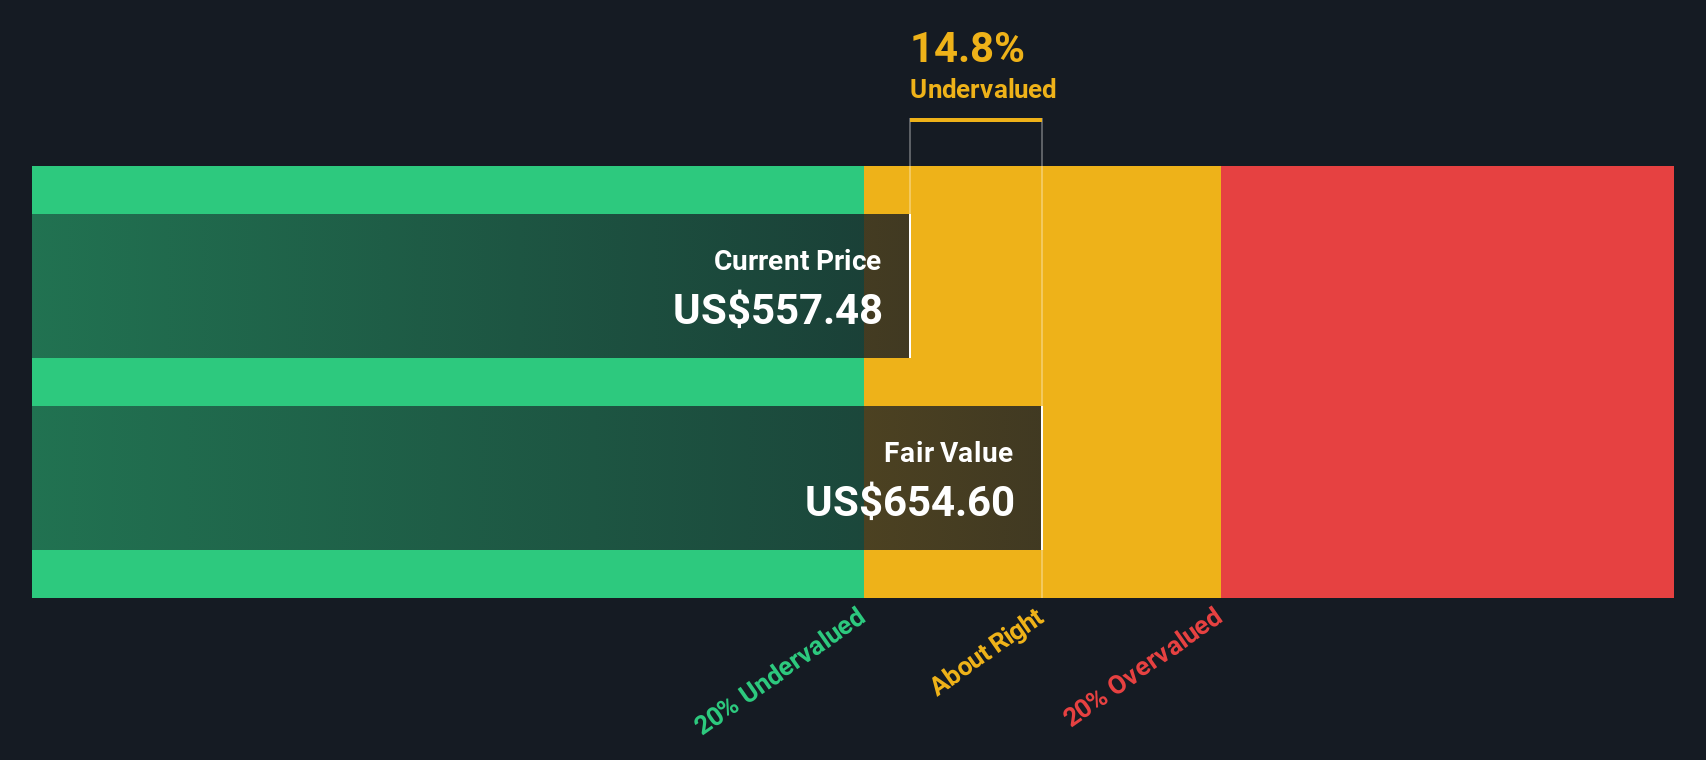
Putting all of this into the Excess Returns framework yields an intrinsic value that is about 13.1% above the current share price of roughly $553. This implies the shares are undervalued rather than priced for perfection.
Result: UNDERVALUED
Our Excess Returns analysis suggests Mastercard is undervalued by 13.1%. Track this in your watchlist or portfolio, or discover 918 more undervalued stocks based on cash flows.
Approach 2: Mastercard Price vs Earnings
For a consistently profitable business like Mastercard, the Price to Earnings (PE) ratio is a sensible way to judge valuation because it links what you pay directly to the earnings the company generates today.
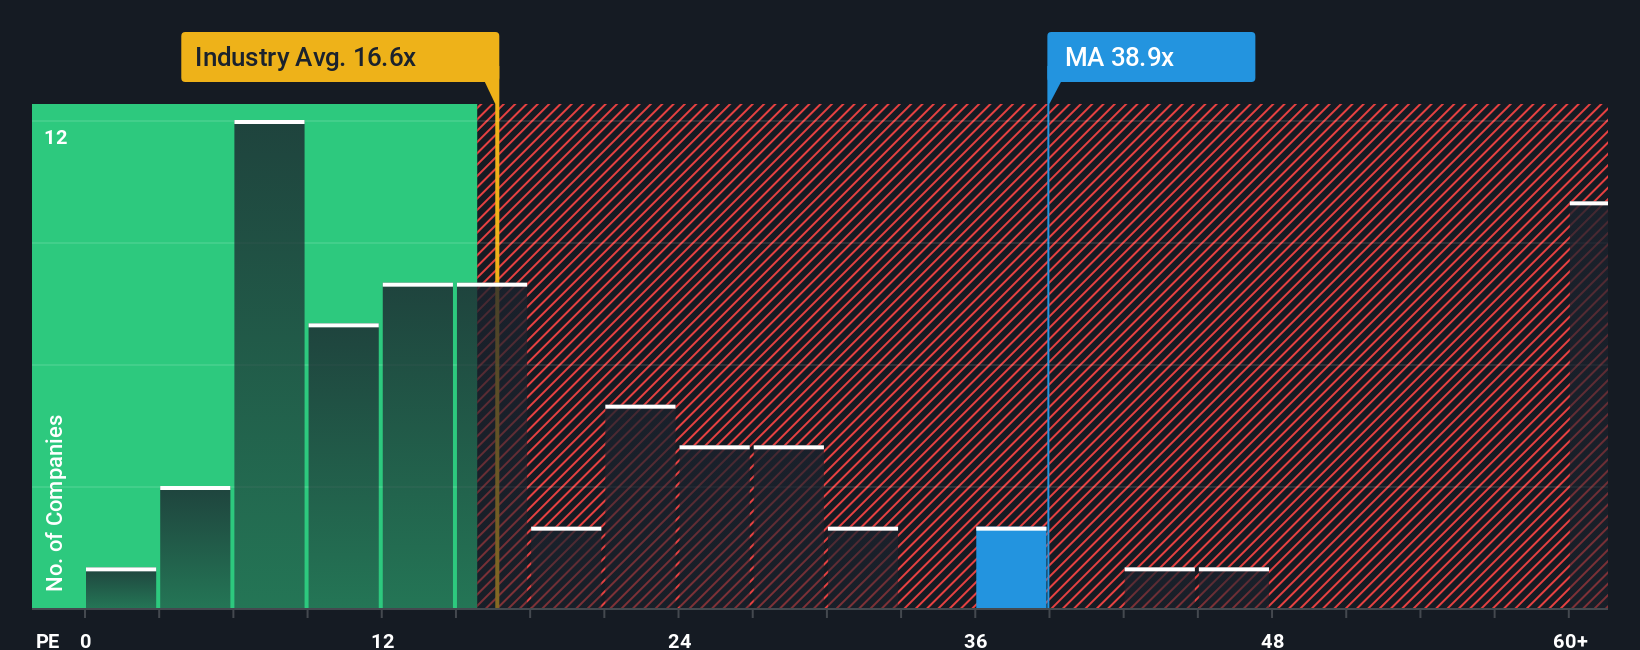
In general, faster growing and lower risk companies deserve a higher PE, while slower growth or higher uncertainty usually means a lower, more conservative multiple. Mastercard currently trades at about 34.9x earnings, which is far richer than the Diversified Financial industry average of roughly 13.7x and also above the peer group average of about 16.3x. This suggests investors are paying a sizable premium for its quality and growth prospects.
Simply Wall St’s Fair Ratio framework estimates what a more reasonable PE should be based on Mastercard’s earnings growth outlook, margins, risk profile, industry, and market cap. For Mastercard, that Fair Ratio is around 19.6x, which is significantly below the current 34.9x. Because the Fair Ratio incorporates growth, profitability, and risk, it is more informative than a simple comparison to industry or peer averages and indicates that, on an earnings multiple basis, the stock looks expensive.
Result: OVERVALUED
PE ratios tell one story, but what if the real opportunity lies elsewhere? Discover 1441 companies where insiders are betting big on explosive growth.
Upgrade Your Decision Making: Choose your Mastercard Narrative
Earlier we mentioned that there is an even better way to understand valuation, so let us introduce you to Narratives, a simple way to turn your view of Mastercard into a story that connects assumptions about its future revenue, earnings and margins to a concrete fair value estimate. A Narrative on Simply Wall St is your structured perspective on a company, where you spell out what you think will drive the business, translate that into a financial forecast, and then see what price those numbers imply. Narratives live inside the Community page on Simply Wall St, used by millions of investors, and make it easy to compare your Fair Value to the current share price so you can decide whether Mastercard looks like a buy, hold or sell. Because Narratives are updated dynamically as new news, earnings or guidance arrives, your fair value can evolve alongside the story. For example, one Mastercard Narrative might lean bullish with a fair value near $690 based on accelerating digital payment growth and rising margins, while a more cautious investor could justify a fair value closer to $520 if they think regulation and new payment rails will cap long term profitability.
Do you think there's more to the story for Mastercard? Head over to our Community to see what others are saying!
This article by Simply Wall St is general in nature. We provide commentary based on historical data and analyst forecasts only using an unbiased methodology and our articles are not intended to be financial advice. It does not constitute a recommendation to buy or sell any stock, and does not take account of your objectives, or your financial situation. We aim to bring you long-term focused analysis driven by fundamental data. Note that our analysis may not factor in the latest price-sensitive company announcements or qualitative material. Simply Wall St has no position in any stocks mentioned.
Have feedback on this article? Concerned about the content? Get in touch with us directly. Alternatively, email editorial-team@simplywallst.com