
 Nasdaq
 华尔街日报
华尔街日报Does Eve Holding’s Recent 30% Surge Reflect Its True Value in 2025?
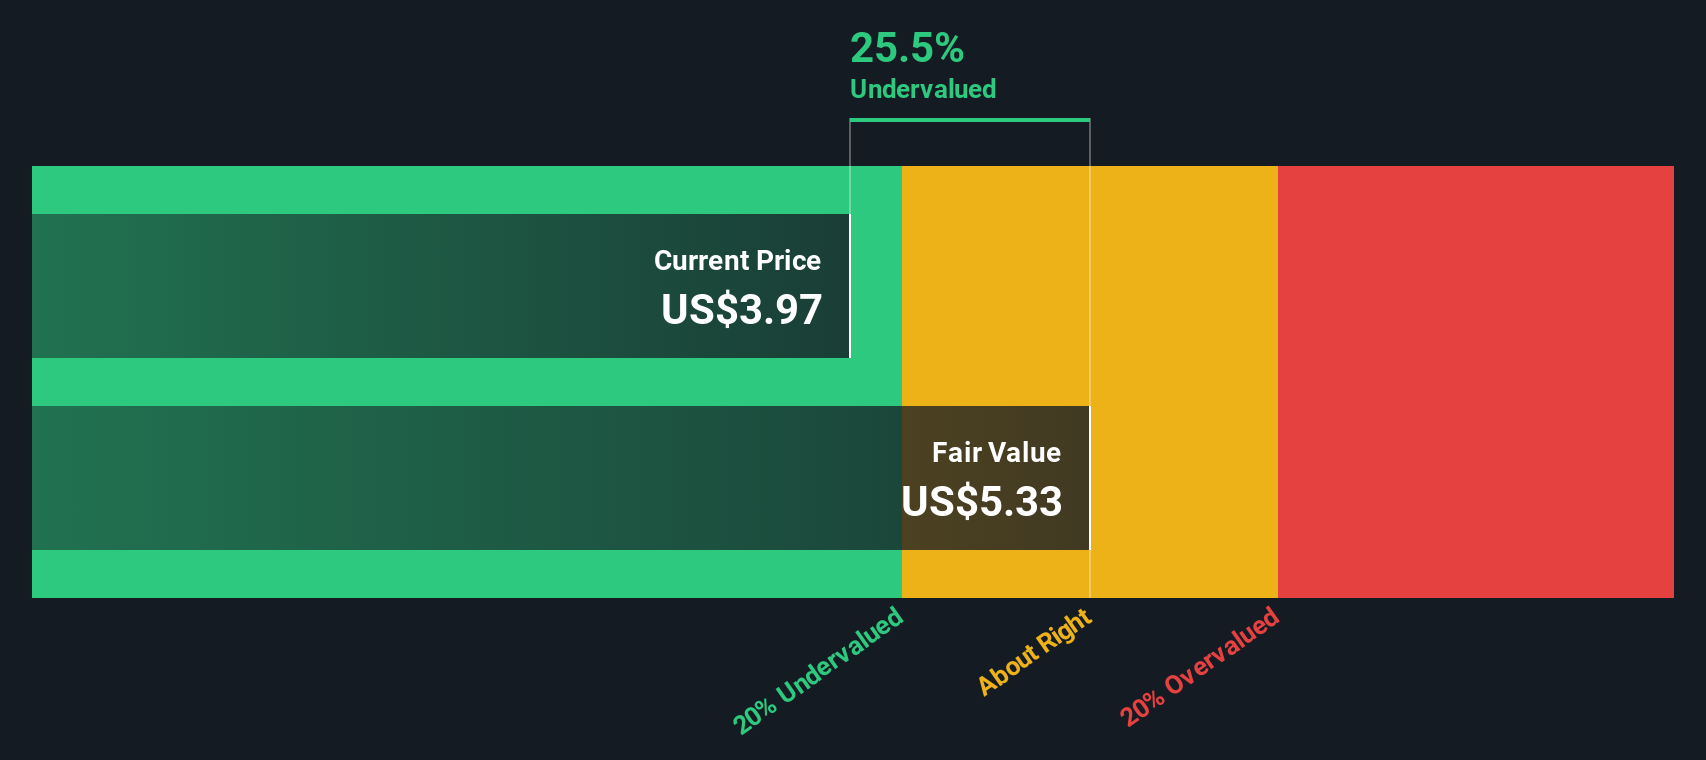
- Wondering if Eve Holding at around $4.87 is a hidden bargain or a value trap? You are not alone in trying to figure out what this stock is really worth.
- The share price has jumped about 29.9% over the last week and 17.9% over the past month, yet it is still down 8.1% year to date and 36.0% over three years, which indicates that sentiment has been shifting quickly.
- Much of the recent interest has centered on Eve's position in the emerging electric vertical take off and landing, or eVTOL, market and its backing from major aviation players. This has kept it on the radar of speculative growth investors. Ongoing milestones in certification progress and partnership updates have also been helping shape expectations about when its business could really start to scale.
- Despite that buzz, Eve Holding currently scores just 0/6 on our valuation checks, suggesting the market may be paying up for future potential rather than current fundamentals. Next we will walk through the usual valuation approaches and then finish with a more powerful way to think about what this stock could be worth.
Eve Holding scores just 0/6 on our valuation checks. See what other red flags we found in the full valuation breakdown.
Approach 1: Eve Holding Discounted Cash Flow (DCF) Analysis
A Discounted Cash Flow model estimates what a company is worth by projecting its future cash flows and discounting them back to today in $ terms. For Eve Holding, the 2 Stage Free Cash Flow to Equity model starts with its last twelve month free cash flow of about $182.8 Million outflow, reflecting a business still in heavy investment mode.
Analysts and extrapolations suggest free cash flow could remain negative for several years, then turn positive, reaching roughly $154.1 Million by 2035 as the eVTOL business scales. Simply Wall St uses analyst forecasts out to 2029 and then extends them to build a 10 year path for these cash flows, before discounting each year back to present value.
On this basis, the DCF model arrives at an intrinsic value of about $4.26 per share. With the stock trading around $4.87, the DCF implies Eve Holding is roughly 14.2% overvalued. This indicates that investors may already be paying a premium that reflects much of the anticipated future growth.
Result: OVERVALUED
Our Discounted Cash Flow (DCF) analysis suggests Eve Holding may be overvalued by 14.2%. Discover 919 undervalued stocks or create your own screener to find better value opportunities.
Approach 2: Eve Holding Price vs Book
For companies that are still loss making or in heavy investment mode, earnings based valuation metrics can be misleading, so the price to book ratio is often a better yardstick. It compares what investors are paying for each dollar of net assets on the balance sheet, which matters a lot for asset intensive, early stage aerospace businesses like Eve Holding.
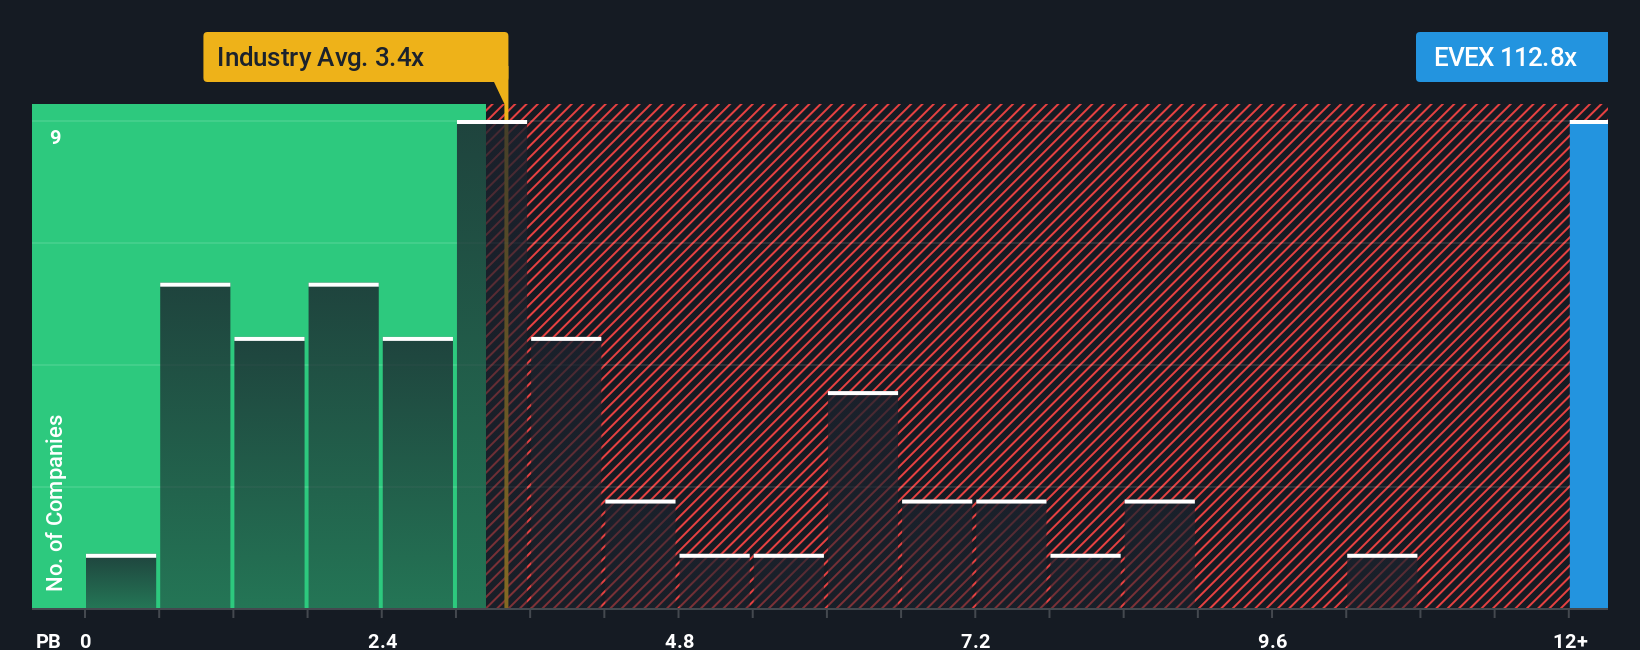
In theory, faster growth and lower risk justify a higher normal price to book multiple, while slower growth or higher uncertainty should pull it down. Eve Holding currently trades at about 9.22x book value, well above both the Aerospace and Defense industry average of roughly 3.36x and a peer group average around 2.77x. That premium suggests investors are pricing in substantial future success long before the business becomes profitable.
Simply Wall St’s Fair Ratio aims to sharpen this comparison by estimating what a reasonable price to book multiple should be after factoring in Eve’s growth outlook, industry, profit margins, market cap and specific risks. Because it tailors the benchmark to the company rather than using a blunt industry or peer average, it is a more precise way to gauge value. With Eve’s actual 9.22x multiple sitting noticeably above this implied fair range, the shares appear richly valued on a price to book basis.
Result: OVERVALUED
PB ratios tell one story, but what if the real opportunity lies elsewhere? Discover 1439 companies where insiders are betting big on explosive growth.
Upgrade Your Decision Making: Choose your Eve Holding Narrative
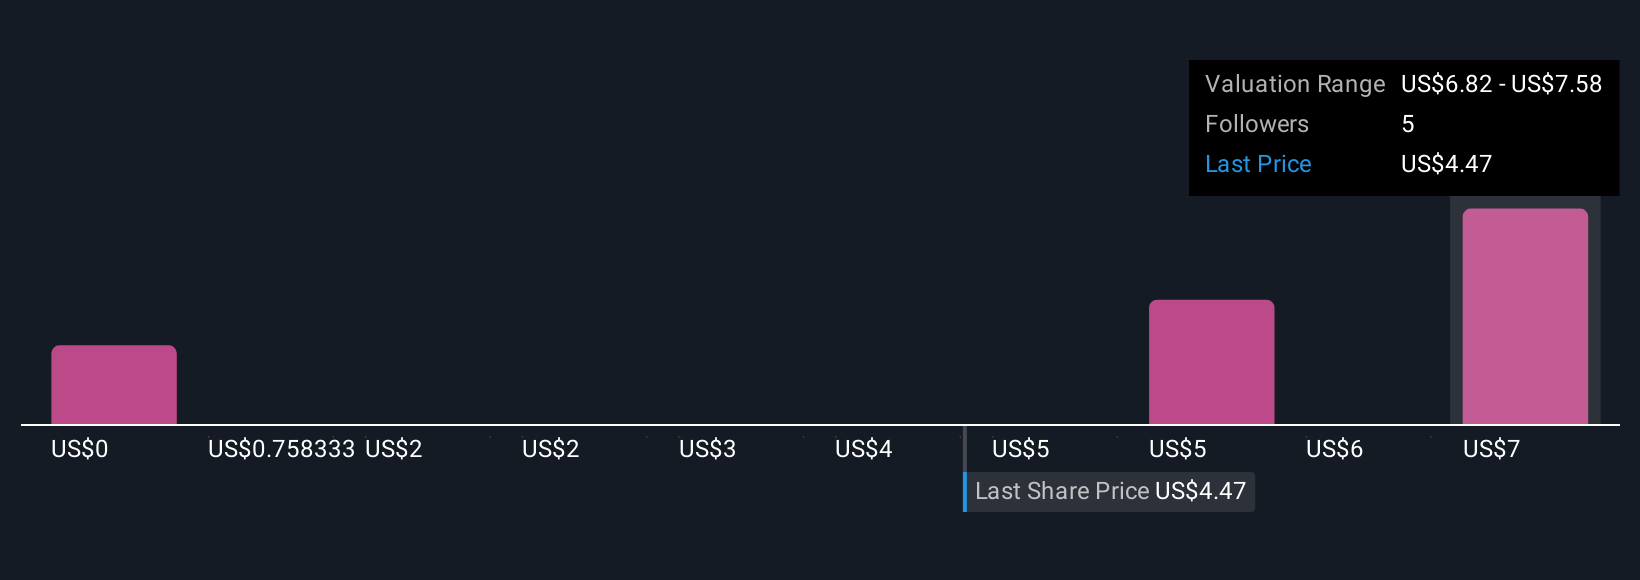
Earlier we mentioned that there is an even better way to understand valuation, so let us introduce you to Narratives, a simple framework that lets you attach a clear story to your numbers by setting your own assumptions for Eve Holding’s future revenue, earnings and margins, then seeing what fair value those assumptions imply. A Narrative links three things together: the company’s story, the financial forecast that follows from that story, and the fair value that drops out at the end, so you can see exactly how your view of Eve translates into a price target. Narratives are available inside Simply Wall St’s Community page, where millions of investors share and compare their views in an easy, accessible format that updates automatically when new earnings, news or guidance arrive. By comparing the Fair Value from your Narrative to Eve Holding’s current share price, you can quickly decide whether it looks like a buy, a hold or a sell. For example, some investors in the community assume very fast adoption and see Eve as significantly undervalued, while others expect slower commercialization and therefore view the stock as overvalued at today’s price.
Do you think there's more to the story for Eve Holding? Head over to our Community to see what others are saying!
This article by Simply Wall St is general in nature. We provide commentary based on historical data and analyst forecasts only using an unbiased methodology and our articles are not intended to be financial advice. It does not constitute a recommendation to buy or sell any stock, and does not take account of your objectives, or your financial situation. We aim to bring you long-term focused analysis driven by fundamental data. Note that our analysis may not factor in the latest price-sensitive company announcements or qualitative material. Simply Wall St has no position in any stocks mentioned.
Have feedback on this article? Concerned about the content? Get in touch with us directly. Alternatively, email editorial-team@simplywallst.com