
 Nasdaq
 华尔街日报
华尔街日报Is It Too Late To Consider ROHM After Its 54.7% Surge?
- Wondering if ROHM is still good value after its recent run up, or if the easy money has already been made? You are in the right place, because this article is all about what the current share price actually bakes in.
- Despite a choppy month where the stock slipped around 14.6% over 30 days, ROHM is still up 41.0% year to date and about 54.7% over the past year. That is the kind of move that often signals expectations are shifting fast.
- Those moves have come as investors refocus on power semiconductors and components tied to structural themes like EVs and industrial automation, where ROHM is a recognized player. At the same time, shifting risk appetite across global chip names has amplified every bout of optimism and caution around the stock.
- Even after that volatility, ROHM only scores 2 out of 6 on our undervaluation checks. We will walk through what the main valuation frameworks are saying now and, toward the end of the article, explore an even richer way to think about what the shares are really worth.
ROHM scores just 2/6 on our valuation checks. See what other red flags we found in the full valuation breakdown.
Approach 1: ROHM Discounted Cash Flow (DCF) Analysis
A Discounted Cash Flow model projects the cash ROHM can generate in the future and then discounts those ¥ amounts back to today to estimate what the whole business is worth now.
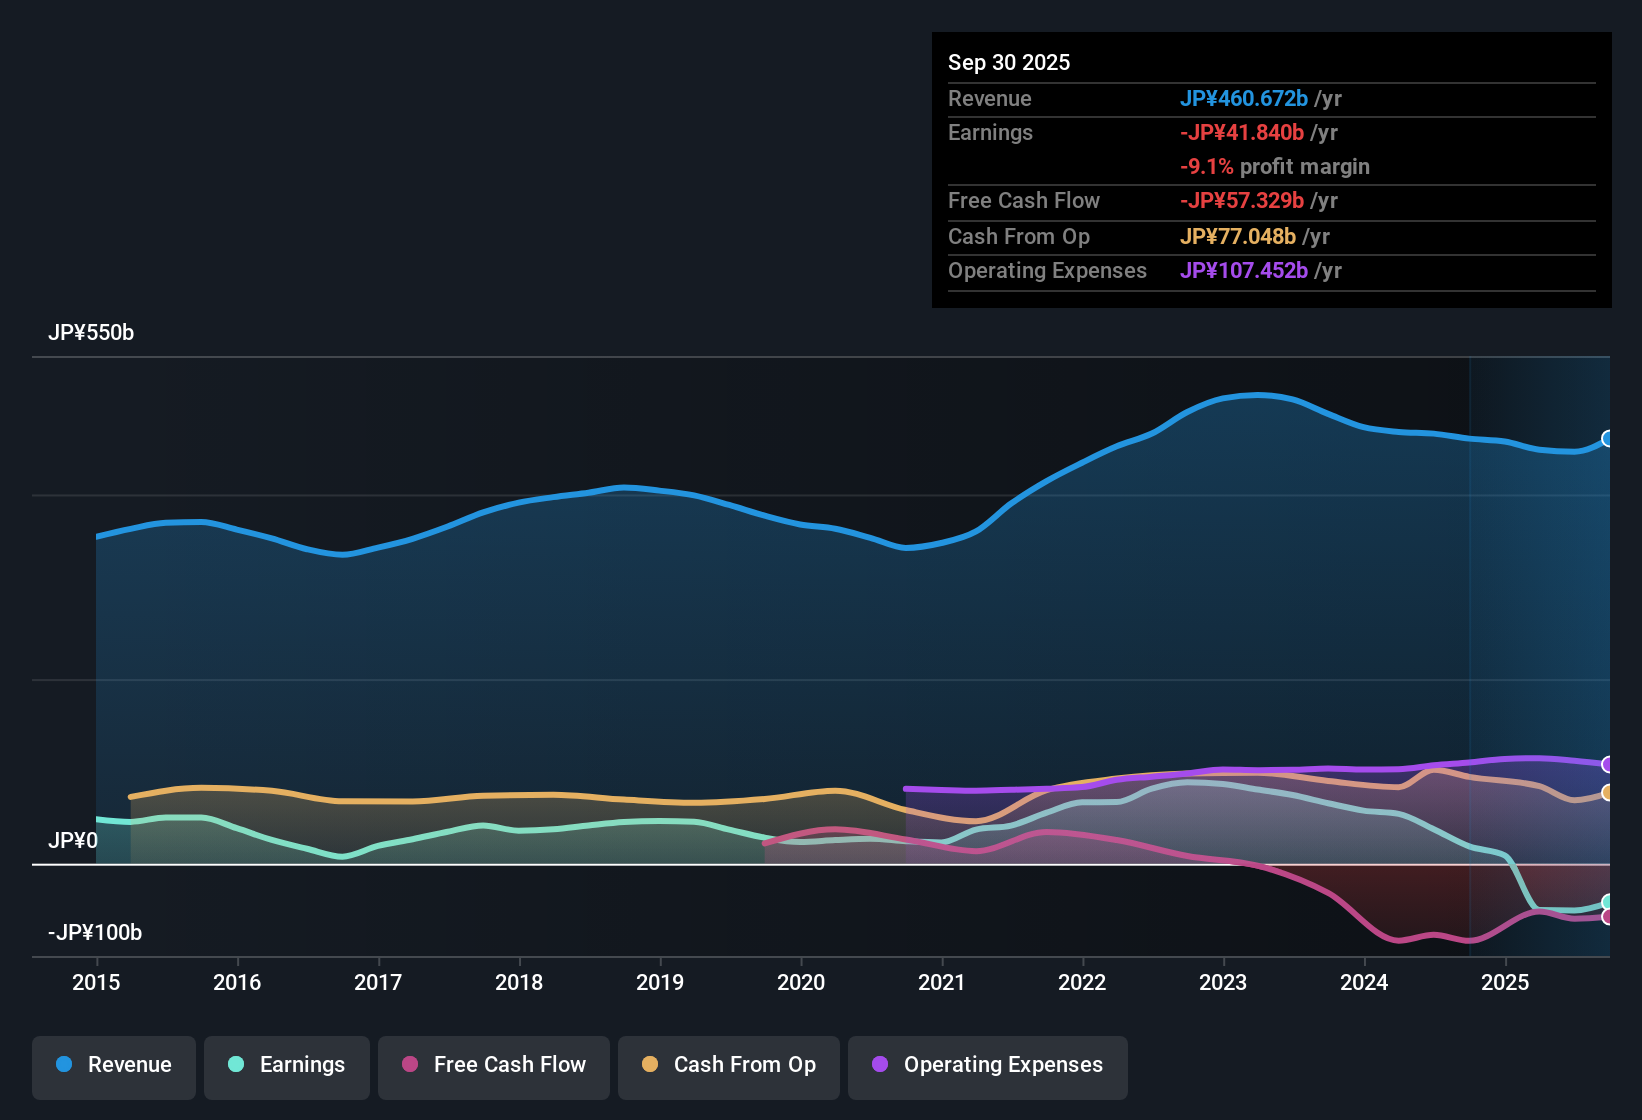
On a trailing basis, ROHM actually reported negative free cash flow of about ¥64.7 billion, which means the model has to rely heavily on a turnaround in future cash generation. Analyst and extrapolated estimates see free cash flow recovering to around ¥75.2 billion in 2026 and then easing back toward roughly ¥14.6 billion by 2035, all in today’s money terms. These projections are modeled using a 2 Stage Free Cash Flow to Equity framework, with near term growth gradually fading into a more mature, slower second stage.
Putting all those discounted cash flows together yields an intrinsic value of about ¥751 per share. The DCF implies the stock is 181.7% overvalued relative to the current market price, which indicates that expectations embedded in the share price are far ahead of ROHM’s cash flow outlook.
Result: OVERVALUED
Our Discounted Cash Flow (DCF) analysis suggests ROHM may be overvalued by 181.7%. Discover 927 undervalued stocks or create your own screener to find better value opportunities.
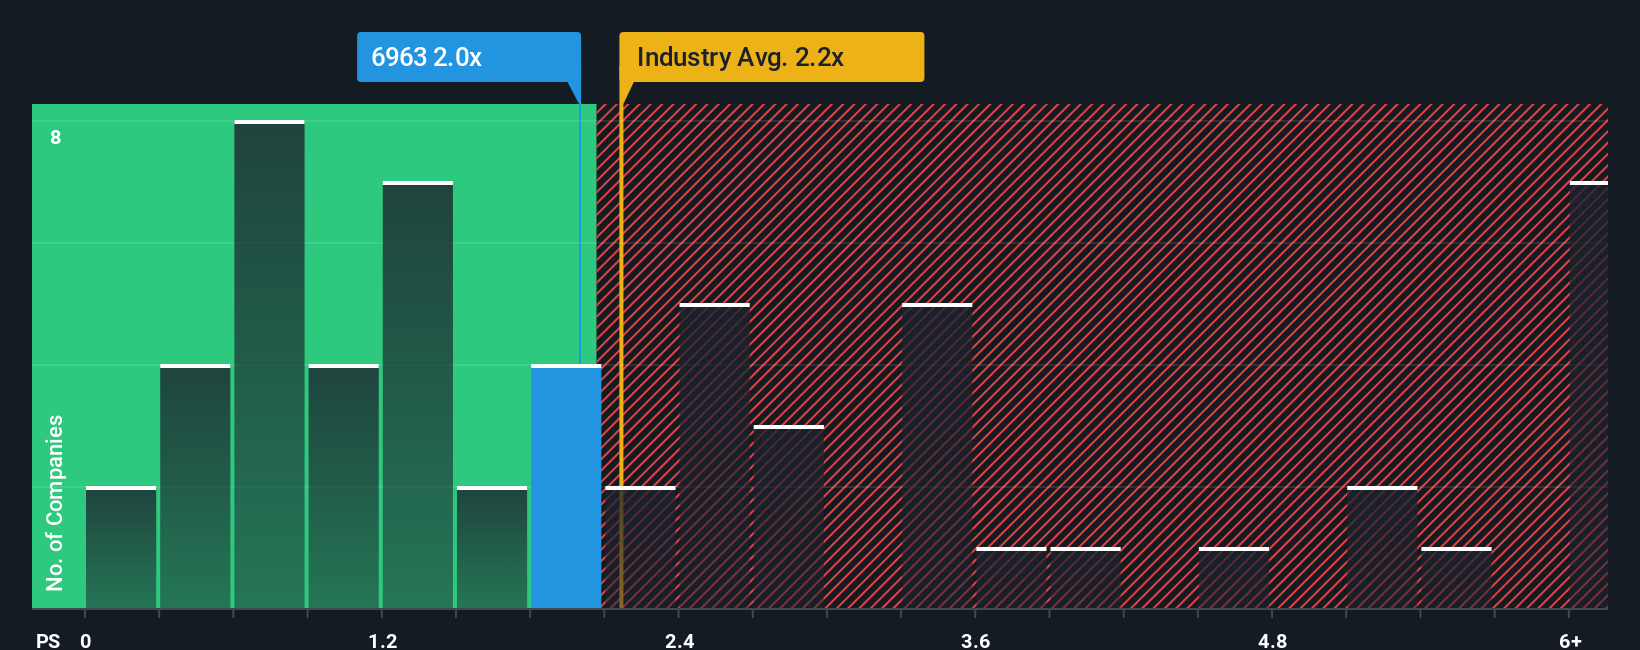
Approach 2: ROHM Price vs Sales
For companies like ROHM that are navigating uneven profits but still generating meaningful revenue, the Price to Sales ratio is a useful way to gauge valuation, because it compares what investors are paying to the scale of the business being generated today.
In general, faster growth and lower perceived risk justify a higher multiple, while slower growth and greater uncertainty warrant a lower one. ROHM currently trades on a Price to Sales ratio of about 1.77x, slightly below the Semiconductor industry average of roughly 1.98x and also under the peer group average of around 2.02x. This suggests the market is applying a modest discount versus comparable chip names.
Simply Wall St’s Fair Ratio framework goes a step further by estimating what a reasonable multiple should be for ROHM given its specific mix of growth prospects, profitability, size and risk profile. For ROHM, that Fair Ratio sits at about 1.63x, implying the shares trade a little above what its fundamentals would typically warrant on this model, even if they look cheap relative to peers.
Result: OVERVALUED
PS ratios tell one story, but what if the real opportunity lies elsewhere? Discover 1439 companies where insiders are betting big on explosive growth.
Upgrade Your Decision Making: Choose your ROHM Narrative
Earlier we mentioned that there is an even better way to understand valuation, so let us introduce you to Narratives, a simple way to connect your view of ROHM’s story with the numbers behind its future revenue, earnings, margins and ultimately its fair value.
A Narrative is your own joined up storyline for a company, where you spell out what you think will happen in the business, translate that view into a financial forecast, and from there into a fair value you can compare with today’s share price to decide whether to buy, hold, or sell.
On Simply Wall St’s Community page, millions of investors use Narratives as an easy, visual tool that automatically refreshes when new information like earnings releases, guidance changes or news on products such as ROHM’s SiC power devices arrives. This helps keep your fair value in sync with reality.
For example, one ROHM Narrative might assume earnings climb toward the more optimistic ¥72.0 billion view and support a fair value closer to ¥2,550. A more cautious Narrative might lean toward ¥39.5 billion in earnings and a fair value near ¥1,300, showing how different perspectives can still be disciplined, numbers based decisions.
Do you think there's more to the story for ROHM? Head over to our Community to see what others are saying!
This article by Simply Wall St is general in nature. We provide commentary based on historical data and analyst forecasts only using an unbiased methodology and our articles are not intended to be financial advice. It does not constitute a recommendation to buy or sell any stock, and does not take account of your objectives, or your financial situation. We aim to bring you long-term focused analysis driven by fundamental data. Note that our analysis may not factor in the latest price-sensitive company announcements or qualitative material. Simply Wall St has no position in any stocks mentioned.
Have feedback on this article? Concerned about the content? Get in touch with us directly. Alternatively, email editorial-team@simplywallst.com