
 Nasdaq
 华尔街日报
华尔街日报Does Universal Health Services Still Offer Value After Its 2024 Rally and Recent Pullback?
- If you have been wondering whether Universal Health Services is still a buy after its strong run, you are not alone. This article explores what the current price might really be baking in.
- The stock has climbed 32.8% year to date and 20.4% over the last year, even after a recent 2.3% pullback this week. This suggests investors are reassessing both its growth potential and its risk profile.
- Part of that momentum reflects ongoing interest in behavioral health and acute care capacity in the US, as hospitals and payors lean on large operators like UHS for scale and stability. At the same time, headlines around healthcare policy, reimbursement dynamics, and shifting demand for mental health services have kept the stock on many investors’ radars as a barometer for the broader sector.
- On our checks, Universal Health Services scores a solid 5/6 valuation score, suggesting it looks undervalued on most metrics. Next, we will walk through the key valuation approaches investors typically use, before finishing with a more holistic way to think about what this business is really worth.
Approach 1: Universal Health Services Discounted Cash Flow (DCF) Analysis
A Discounted Cash Flow model estimates what a company is worth by forecasting its future cash flows and then discounting them back to today, using a required rate of return. For Universal Health Services, the model starts with last twelve month Free Cash Flow of about $1.0 billion and projects this rising steadily over time as the hospital portfolio expands and margins improve.
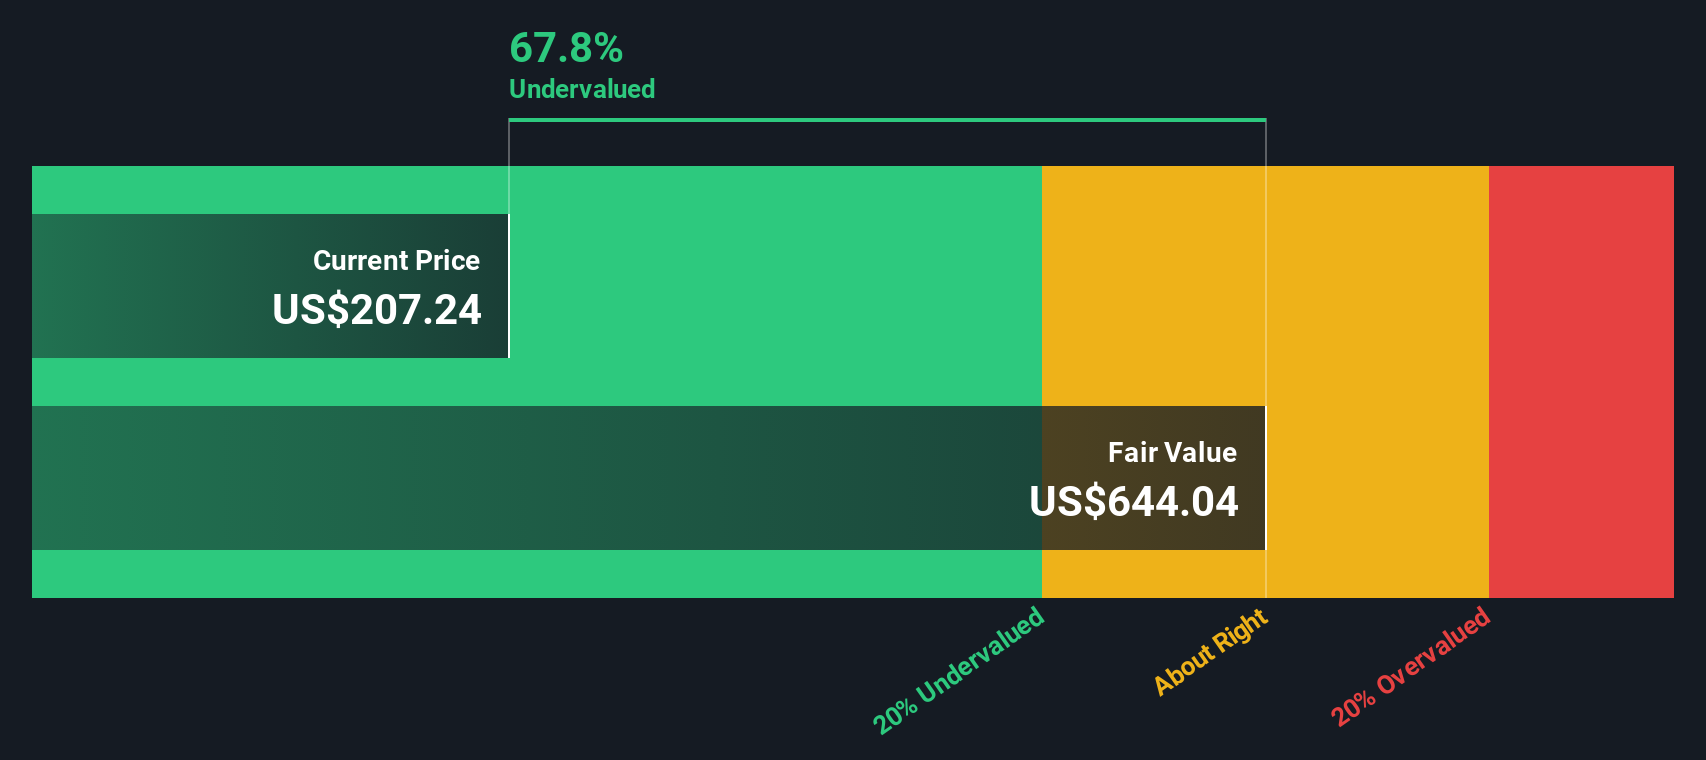
Analyst and internal projections see Free Cash Flow reaching roughly $1.77 billion by 2035, with growth gradually slowing from the mid single digits as the business matures. Simply Wall St uses a 2 stage Free Cash Flow to Equity framework, combining these yearly forecasts with a long term terminal value to arrive at an intrinsic value of about $569.48 per share.
Compared with the current share price, this implies the stock is about 58.1% undervalued on a cash flow basis, which indicates the market may be overly cautious about long term reimbursement and demand risks.
Result: UNDERVALUED
Our Discounted Cash Flow (DCF) analysis suggests Universal Health Services is undervalued by 58.1%. Track this in your watchlist or portfolio, or discover 925 more undervalued stocks based on cash flows.
Approach 2: Universal Health Services Price vs Earnings
For a consistently profitable business like Universal Health Services, the Price to Earnings (PE) ratio is a useful way to judge how much investors are paying for each dollar of current earnings. In general, faster growth and lower perceived risk can justify a higher PE, while slower growth or higher uncertainty typically lead to a lower, more conservative multiple.
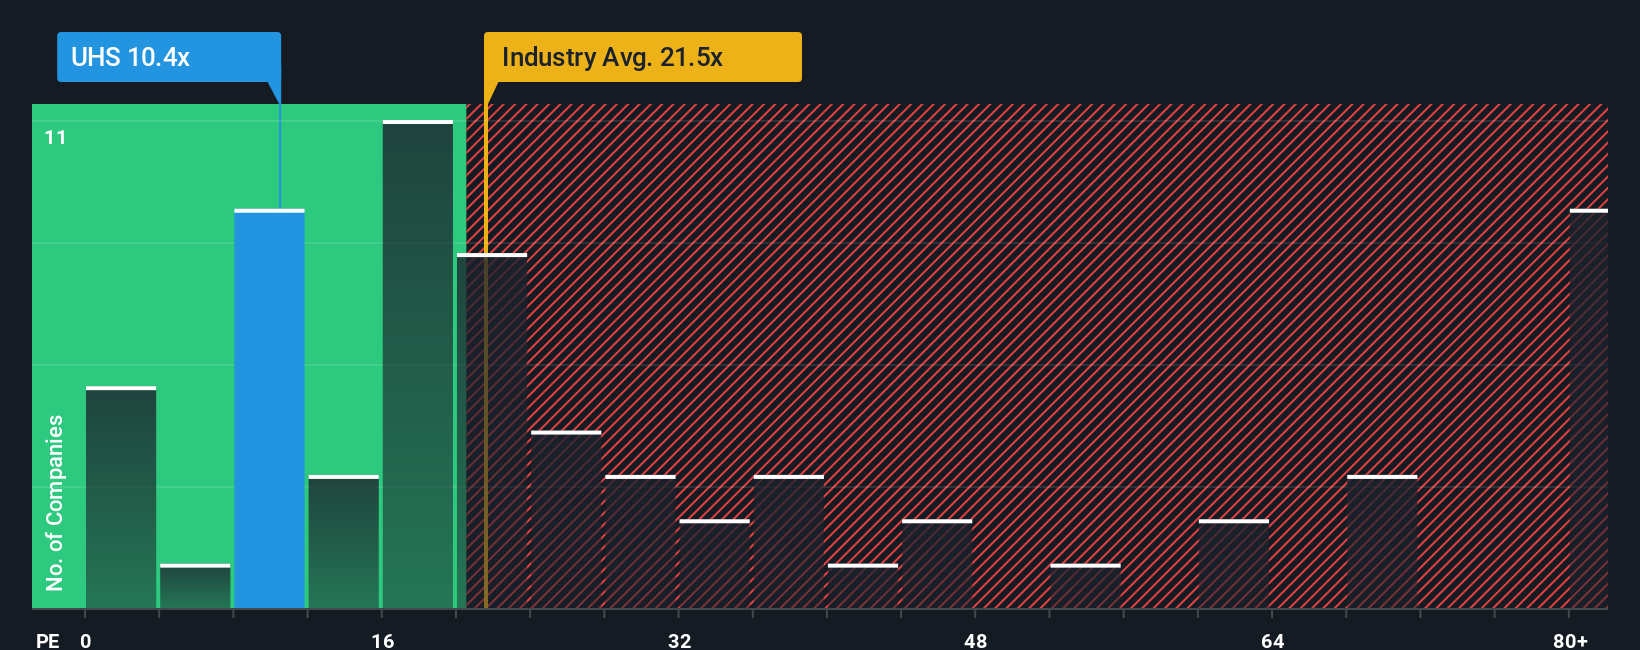
Universal Health Services currently trades at about 10.84x earnings, which is well below the broader Healthcare industry average of roughly 22.14x and the peer group average of about 24.01x. Simply Wall St also calculates a Fair Ratio of 23.29x for Universal Health Services, which is the PE level the company might reasonably command given its earnings growth outlook, profitability, size, industry positioning, and risk profile.
This Fair Ratio is more informative than a simple industry or peer comparison because it explicitly adjusts for Universal Health Services specific fundamentals rather than assuming it should trade in line with a broad group. Comparing the current 10.84x PE to the Fair Ratio of 23.29x indicates that the market is assigning a sizeable discount to the stock on an earnings basis.
Result: UNDERVALUED
PE ratios tell one story, but what if the real opportunity lies elsewhere? Discover 1441 companies where insiders are betting big on explosive growth.
Upgrade Your Decision Making: Choose your Universal Health Services Narrative
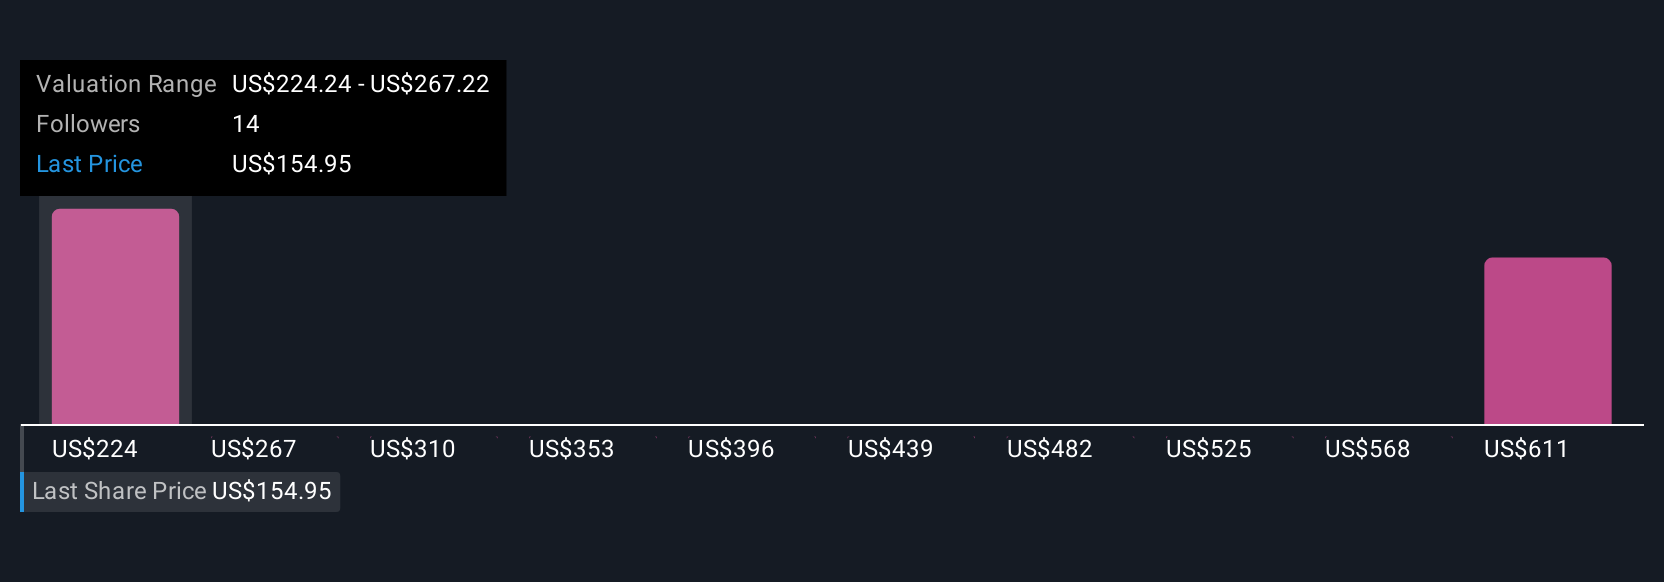
Earlier we mentioned that there is an even better way to understand valuation. Let us introduce you to Narratives, an approach where you combine your view of Universal Health Services future revenue, earnings, and margins with a clear story about its business. The platform automatically links that story to a financial forecast, a fair value, and an easy buy or sell signal by comparing that fair value to the current price, updating dynamically as new news or earnings arrive, all within the Simply Wall St Community page that millions of investors already use. One investor might build a more optimistic Universal Health Services Narrative around accelerating behavioral health demand, margin expansion, and steady policy support that justifies a fair value closer to the bullish 280 dollars target. Another might focus on reimbursement cuts, labor pressures, and competitive threats that anchor their Narrative near the more cautious 165 dollars view. Both can quickly see how their assumptions translate into numbers and what that implies for their next move.
Do you think there's more to the story for Universal Health Services? Head over to our Community to see what others are saying!
This article by Simply Wall St is general in nature. We provide commentary based on historical data and analyst forecasts only using an unbiased methodology and our articles are not intended to be financial advice. It does not constitute a recommendation to buy or sell any stock, and does not take account of your objectives, or your financial situation. We aim to bring you long-term focused analysis driven by fundamental data. Note that our analysis may not factor in the latest price-sensitive company announcements or qualitative material. Simply Wall St has no position in any stocks mentioned.
Have feedback on this article? Concerned about the content? Get in touch with us directly. Alternatively, email editorial-team@simplywallst.com