
 Nasdaq
 华尔街日报
华尔街日报Inquiry Into EMCOR Group's Competitor Dynamics In Construction & Engineering Industry
In today's rapidly changing and fiercely competitive business landscape, it is vital for investors and industry enthusiasts to carefully evaluate companies. In this article, we will perform a comprehensive industry comparison, evaluating EMCOR Group (NYSE:EME) against its key competitors in the Construction & Engineering industry. By analyzing important financial metrics, market position, and growth prospects, we aim to provide valuable insights for investors and shed light on company's performance within the industry.
EMCOR Group Background
EMCOR Group Inc is a specialty contractor in the United States and a provider of electrical and mechanical construction and facilities services, building services, and industrial services. Its services are provided to a broad range of commercial, technology, manufacturing, industrial, healthcare, utility, and institutional customers through approximately 100 operating subsidiaries. The company's operating subsidiaries are organized into reportable segments: United States mechanical construction and facilities services, which derives key revenue; United States electrical construction and facilities services; United States building services; United States industrial services; and United Kingdom building services. Geographically, its key revenue is derived from the United States.
| Company | P/E | P/B | P/S | ROE | EBITDA (in billions) | Gross Profit (in billions) | Revenue Growth |
|---|---|---|---|---|---|---|---|
| EMCOR Group Inc | 24.41 | 8.14 | 1.70 | 9.25% | $0.45 | $0.84 | 16.35% |
| Quanta Services Inc | 67.37 | 8.08 | 2.52 | 4.18% | $0.77 | $1.22 | 17.53% |
| Comfort Systems USA Inc | 39.65 | 14.78 | 3.99 | 13.87% | $0.41 | $0.61 | 35.24% |
| MasTec Inc | 50.71 | 5.40 | 1.22 | 5.3% | $0.36 | $0.54 | 21.97% |
| APi Group Corp | 107.89 | 4.93 | 2.14 | 2.61% | $0.24 | $0.65 | 14.18% |
| AECOM | 21.29 | 5.39 | 0.84 | 4.83% | $0.31 | $0.33 | 1.58% |
| Stantec Inc | 31.10 | 4.66 | 1.88 | 4.78% | $0.32 | $0.93 | 10.94% |
| Dycom Industries Inc | 34.87 | 6.92 | 2.01 | 7.46% | $0.22 | $0.32 | 14.13% |
| Sterling Infrastructure Inc | 32.14 | 9.58 | 4.54 | 9.53% | $0.15 | $0.17 | 16.05% |
| IES Holdings Inc | 27.76 | 9.37 | 2.50 | 12.07% | $0.12 | $0.23 | 15.73% |
| Valmont Industries Inc | 34.91 | 5.02 | 1.99 | 6.34% | $0.16 | $0.32 | 2.53% |
| Fluor Corp | 2.15 | 1.33 | 0.46 | -12.52% | $-0.46 | $-0.45 | -17.73% |
| Primoris Services Corp | 24.70 | 4.14 | 0.92 | 5.98% | $0.16 | $0.24 | 32.1% |
| Construction Partners Inc | 57.25 | 6.53 | 2.07 | 6.41% | $0.14 | $0.16 | 67.21% |
| Arcosa Inc | 35.13 | 2.01 | 1.84 | 2.87% | $0.17 | $0.19 | 24.58% |
| Argan Inc | 42.86 | 12.56 | 5.47 | 9.32% | $0.03 | $0.04 | 4.73% |
| Everus Construction Group Inc | 25.76 | 8.13 | 1.33 | 10.48% | $0.08 | $0.12 | 29.68% |
| Granite Construction Inc | 29.09 | 4.02 | 1.33 | 9.28% | $0.21 | $0.26 | 12.39% |
| WillScot Holdings Corp | 16.60 | 3.45 | 1.61 | 4.14% | $0.23 | $0.28 | -5.75% |
| MYR Group Inc | 35.26 | 5.47 | 0.98 | 5.35% | $0.06 | $0.11 | 7.02% |
| Centuri Holdings Inc | 611.50 | 4.16 | 0.76 | 0.36% | $0.08 | $0.08 | 18.05% |
| Ameresco Inc | 29.47 | 1.75 | 0.99 | 1.77% | $0.07 | $0.08 | 5.01% |
| Cadeler AS | 4.93 | 0.91 | 2.46 | 4.59% | $0.11 | $0.1 | 91.46% |
| Average | 61.93 | 5.84 | 1.99 | 5.41% | $0.18 | $0.3 | 19.03% |
After a detailed analysis of EMCOR Group, the following trends become apparent:
The stock's Price to Earnings ratio of 24.41 is lower than the industry average by 0.39x, suggesting potential value in the eyes of market participants.
With a Price to Book ratio of 8.14, which is 1.39x the industry average, EMCOR Group might be considered overvalued in terms of its book value, as it is trading at a higher multiple compared to its industry peers.
With a relatively low Price to Sales ratio of 1.7, which is 0.85x the industry average, the stock might be considered undervalued based on sales performance.
The company has a higher Return on Equity (ROE) of 9.25%, which is 3.84% above the industry average. This suggests efficient use of equity to generate profits and demonstrates profitability and growth potential.
The Earnings Before Interest, Taxes, Depreciation, and Amortization (EBITDA) of $450 Million is 2.5x above the industry average, highlighting stronger profitability and robust cash flow generation.
With higher gross profit of $840 Million, which indicates 2.8x above the industry average, the company demonstrates stronger profitability and higher earnings from its core operations.
The company's revenue growth of 16.35% is significantly below the industry average of 19.03%. This suggests a potential struggle in generating increased sales volume.
Debt To Equity Ratio
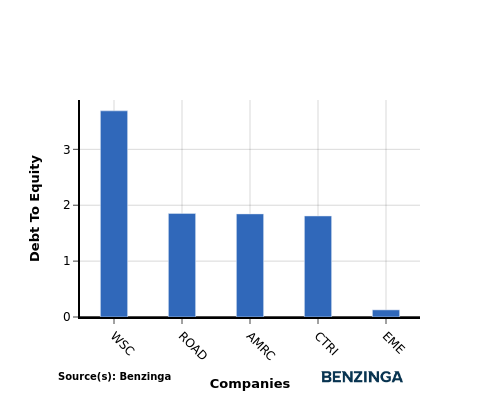
The debt-to-equity (D/E) ratio is a measure that indicates the level of debt a company has taken on relative to the value of its assets net of liabilities.
Considering the debt-to-equity ratio in industry comparisons allows for a concise evaluation of a company's financial health and risk profile, aiding in informed decision-making.
When examining EMCOR Group in comparison to its top 4 peers with respect to the Debt-to-Equity ratio, the following information becomes apparent:
Compared to its top 4 peers, EMCOR Group has a stronger financial position indicated by its lower debt-to-equity ratio of 0.13.
This suggests that the company relies less on debt financing and has a more favorable balance between debt and equity, which can be seen as a positive attribute by investors.
Key Takeaways
For EMCOR Group in the Construction & Engineering industry, the PE ratio is low compared to peers, indicating potential undervaluation. The high PB ratio suggests the market values the company's assets highly. A low PS ratio implies the stock price may not fully reflect revenue. The high ROE, EBITDA, and gross profit signify strong profitability, while the low revenue growth may indicate stability rather than rapid expansion.
This article was generated by Benzinga's automated content engine and reviewed by an editor.