
 Nasdaq
 华尔街日报
华尔街日报What Chevron’s Cash Flows and PE Ratio Say After Recent Capital Spending Push
- Wondering if Chevron is a solid value play or if most of the upside is already priced in? This article is going to walk through what the numbers are really saying about the stock.
- Chevron has been a bit choppy lately, up 1.2% over the last week but down 4.7% over the past month, while still sitting 2.4% higher year to date and roughly flat over 3 years. Over 5 years, it has doubled investors' money with a 103.0% gain.
- Recent headlines have focused on Chevron's strategic capital spending in large scale upstream projects and ongoing portfolio optimization in areas like shale and LNG. These factors help explain some of the market's shifting expectations. At the same time, macro news around oil price volatility and the energy transition narrative continues to influence how investors think about Chevron's long term cash flows and risk profile.
- On our framework, Chevron scores a 3/6 valuation check score, suggesting it looks undervalued on some metrics but not across the board. Next we will break down the main valuation approaches and, by the end, look at an even better way to make sense of what the stock is really worth.
Find out why Chevron's -2.9% return over the last year is lagging behind its peers.
Approach 1: Chevron Discounted Cash Flow (DCF) Analysis
A Discounted Cash Flow model estimates what a company is worth by projecting the cash it can generate in the future, then discounting those cash flows back to today in dollar terms.
For Chevron, the latest twelve month Free Cash Flow sits at about $16.3 billion. Analysts expect this to rise steadily, with projections and extrapolations pointing to Free Cash Flow of roughly $32.4 billion in ten years under a 2 Stage Free Cash Flow to Equity framework. Early year forecasts come from multiple analyst estimates, while the outer years are extrapolated by Simply Wall St based on more modest long term growth assumptions.
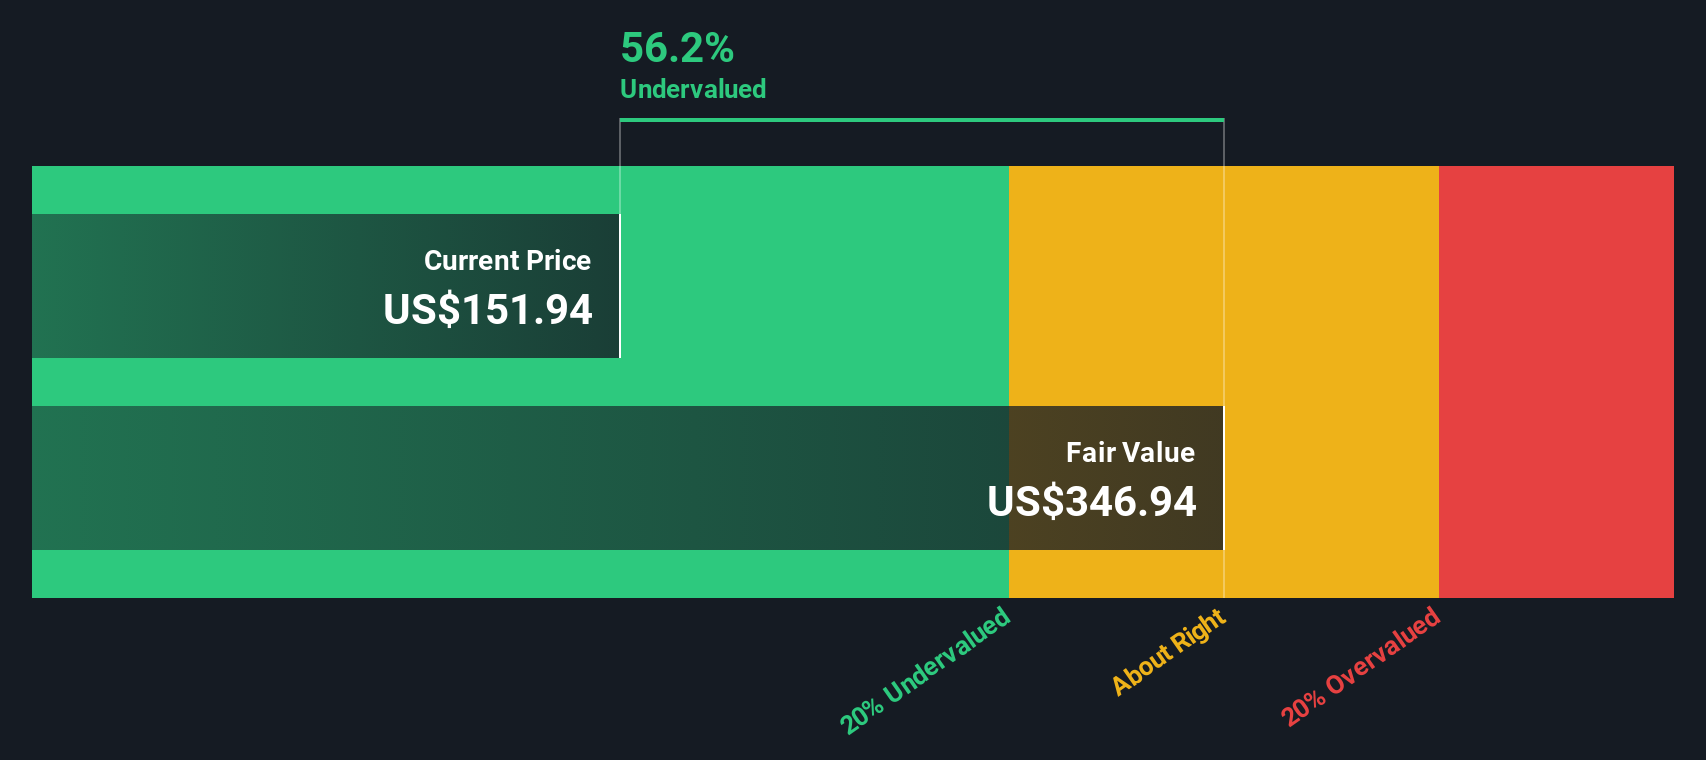
Bringing those future cash flows back to today, the DCF model arrives at an intrinsic value of about $325.79 per share. Compared with the current share price, this indicates Chevron is trading at roughly a 53.9% discount, which in this framework suggests the market is pricing in a significantly more negative long term outlook than the cash flow projections.
Result: UNDERVALUED
Our Discounted Cash Flow (DCF) analysis suggests Chevron is undervalued by 53.9%. Track this in your watchlist or portfolio, or discover 925 more undervalued stocks based on cash flows.
Approach 2: Chevron Price vs Earnings
For a mature, consistently profitable business like Chevron, the Price to Earnings (PE) ratio is a practical way to gauge valuation because it anchors the share price to actual, ongoing earnings power rather than just assets or revenue volume.
In general, companies with stronger growth prospects and lower perceived risk tend to justify a higher, or premium, PE multiple, while slower growing or riskier names usually trade on a lower PE. That is why the headline PE needs context to be useful.
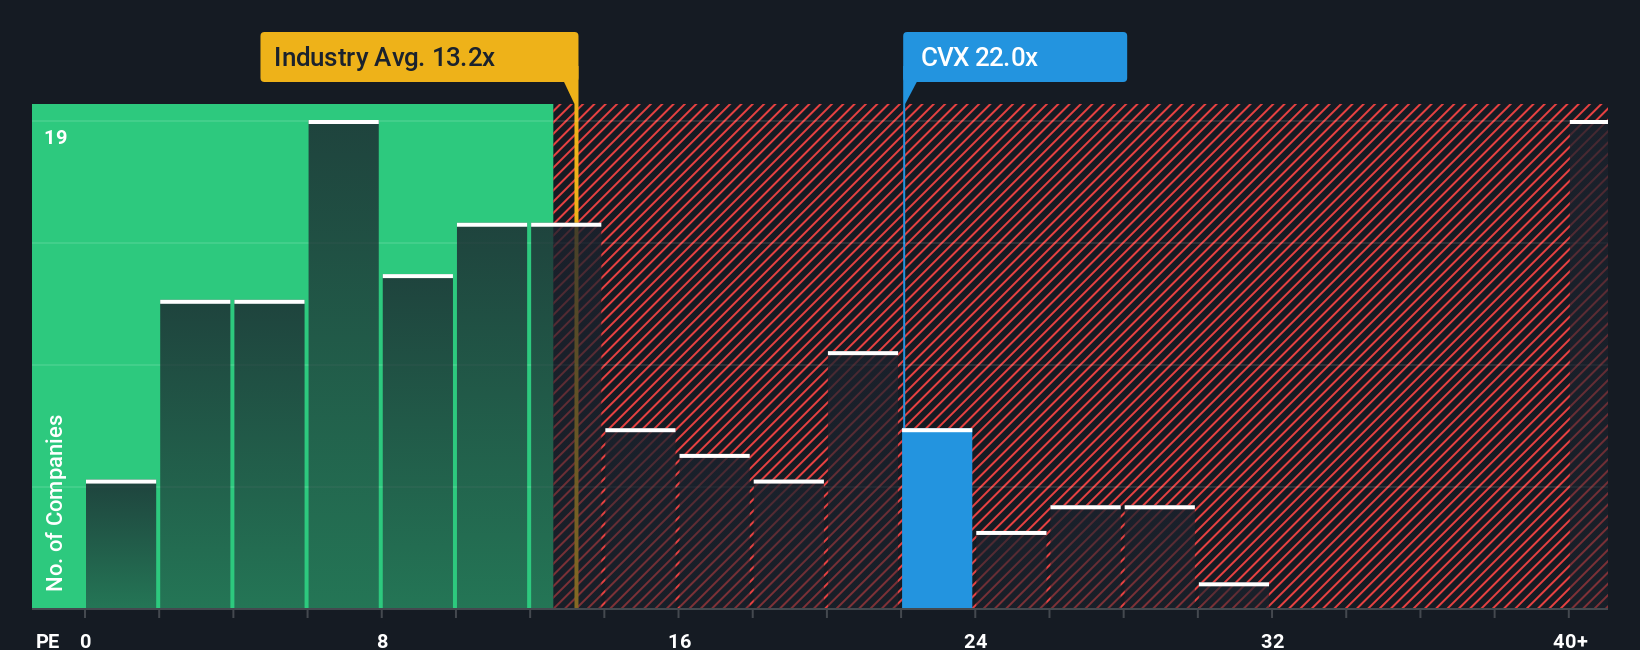
Chevron currently trades on a PE of about 23.7x, which is well above the Oil and Gas industry average of roughly 13.5x, and slightly higher than the peer group average of around 22.0x. Simply Wall St’s Fair Ratio model estimates that, given Chevron’s growth profile, margins, size and risk, a PE closer to 25.3x would be reasonable.
This Fair Ratio is more informative than a simple peer or industry comparison because it adjusts for Chevron’s specific fundamentals instead of assuming all energy companies deserve the same multiple. With the current PE below the 25.3x Fair Ratio, the stock screens as modestly undervalued on this metric.
Result: UNDERVALUED
PE ratios tell one story, but what if the real opportunity lies elsewhere? Discover 1441 companies where insiders are betting big on explosive growth.
Upgrade Your Decision Making: Choose your Chevron Narrative
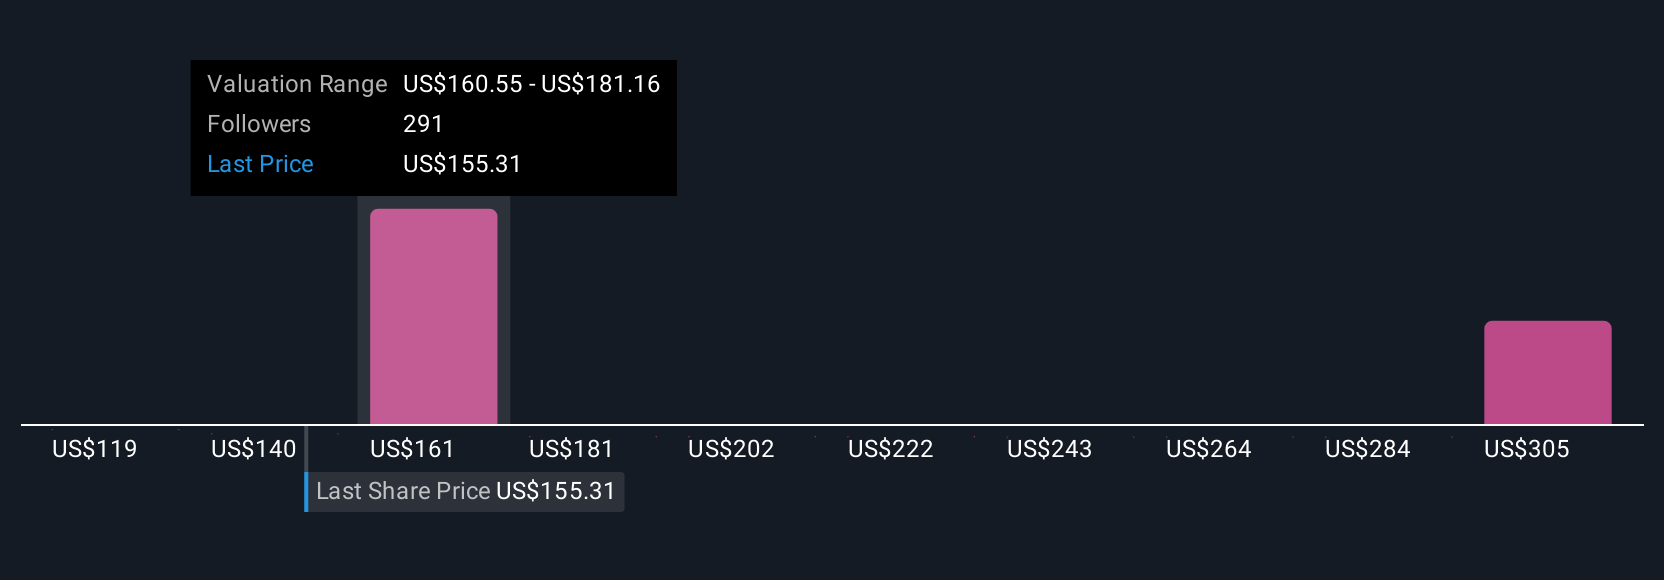
Earlier we mentioned that there is an even better way to understand valuation, so let us introduce Narratives. This is a simple way for you to attach your own story about Chevron to the numbers by turning your view on its future revenues, earnings and margins into a financial forecast that flows through to a Fair Value you can compare against today’s price to help inform your decision. You can do this within an easy to use tool on Simply Wall St’s Community page that updates automatically as new news or earnings arrive. For example, one investor might build a bullish Chevron Narrative around resilient dividend growth, integration of Hess assets and improving margins that supports a Fair Value near the upper analyst target of about $197. Another investor might create a more cautious Narrative focused on energy transition risks, project execution uncertainty and regulatory pressure that anchors Fair Value closer to the low end of published targets around $124. This shows how the same company can justifiably support very different but clearly quantified investment views.
Do you think there's more to the story for Chevron? Head over to our Community to see what others are saying!
This article by Simply Wall St is general in nature. We provide commentary based on historical data and analyst forecasts only using an unbiased methodology and our articles are not intended to be financial advice. It does not constitute a recommendation to buy or sell any stock, and does not take account of your objectives, or your financial situation. We aim to bring you long-term focused analysis driven by fundamental data. Note that our analysis may not factor in the latest price-sensitive company announcements or qualitative material. Simply Wall St has no position in any stocks mentioned.
Have feedback on this article? Concerned about the content? Get in touch with us directly. Alternatively, email editorial-team@simplywallst.com