
 Nasdaq
 华尔街日报
华尔街日报Is SAP Still Attractively Priced After Its Volatile 2025 Share Price Performance?
- Wondering if SAP is a bargain or just fairly priced after its big run up over the last few years? This breakdown will help you decide whether the stock still earns a place on your watchlist.
- Recently, SAP has been choppy, up 1.5% over the last week but down 7.4% over the past month, with the stock now sitting about 12.9% lower year to date and roughly 10.0% off over the last 12 months, while still having more than doubled over 3 and 5 years.
- These swings have come as investors digest SAP's continued push into cloud based solutions and AI driven tools, and its role as a key software backbone for large enterprises navigating digital transformation. At the same time, shifting expectations around interest rates and tech valuations broadly have amplified every piece of news tied to its competitive position and long term growth story.
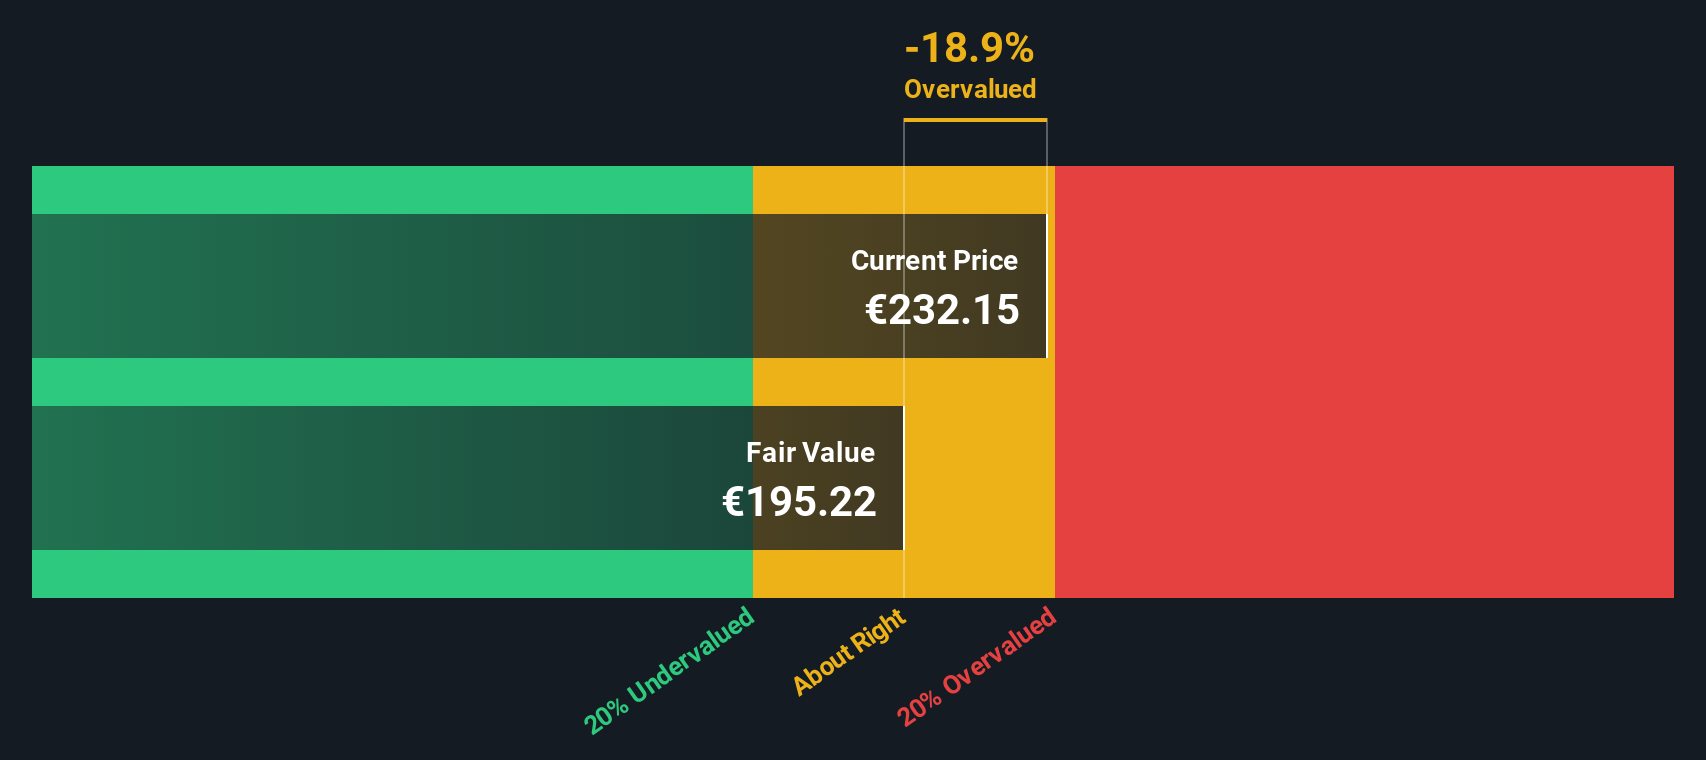
- On our valuation checks, SAP scores a 3/6. This suggests the market is not giving it away, but it is not outrageously priced either. Next we will unpack how different valuation approaches see the stock, and later circle back to a more intuitive way to think about its real value in your portfolio.
Approach 1: SAP Discounted Cash Flow (DCF) Analysis
A Discounted Cash Flow, or DCF, model estimates what a company is worth by projecting the cash it can generate in the future and then discounting those cash flows back into today’s euros.
For SAP, the latest twelve month free cash flow is about €6.4 billion, and analysts expect this to climb steadily as the business scales its cloud and AI offerings. Simply Wall St uses analyst forecasts for the next few years, then extends these trends further out, with projected free cash flow in around 10 years approaching the mid teens in billions of euros.
When all those future cash flows are discounted back to today and divided across the share count, the model arrives at an intrinsic value of roughly €253 per share. Compared with the current share price, this indicates SAP is around 17.8% undervalued, which suggests the market is not fully pricing in its long term cash generation potential.
Result: UNDERVALUED
Our Discounted Cash Flow (DCF) analysis suggests SAP is undervalued by 17.8%. Track this in your watchlist or portfolio, or discover 925 more undervalued stocks based on cash flows.
Approach 2: SAP Price vs Earnings
For a profitable, established software leader like SAP, the price to earnings, or PE, ratio is a useful way to gauge how much investors are willing to pay today for each euro of current earnings. A higher PE usually reflects stronger growth expectations and a lower perceived risk profile, while slower growth or higher uncertainty tend to justify a lower, more conservative multiple.
SAP currently trades on a PE of about 34.2x. That is a premium to the wider Software industry average of roughly 27.4x and also above its direct peer group, which sits closer to 31.3x. On the surface, that suggests investors are already paying up for SAP’s scale, recurring revenue and cloud transition progress.
Simply Wall St’s Fair Ratio framework goes a step further by estimating what PE SAP should trade on, given its earnings growth outlook, profitability, industry, market cap and company specific risks. This proprietary Fair Ratio for SAP comes out at around 38.0x, higher than both the current multiple and the peer and industry benchmarks. Because it incorporates growth and risk rather than just comparing against averages, it offers a more tailored anchor for valuation. With the market currently valuing SAP below this Fair Ratio, the stock appears modestly undervalued on a PE basis.
Result: UNDERVALUED

PE ratios tell one story, but what if the real opportunity lies elsewhere? Discover 1441 companies where insiders are betting big on explosive growth.
Upgrade Your Decision Making: Choose your SAP Narrative
Earlier we mentioned that there is an even better way to understand valuation, so let us introduce you to Narratives, a simple, story driven way to connect your view of SAP’s business with concrete forecasts for revenue, earnings and margins, and ultimately a fair value estimate. On Simply Wall St’s Community page, millions of investors use Narratives to write down their thesis for a company, link that story to explicit assumptions in a forecast model, and see the fair value that drops out, then compare it with the current share price to help inform whether to buy, hold or sell. Because Narratives are tied into live data, they automatically update when new earnings, news or guidance are released, so your story and numbers stay aligned without any manual spreadsheet work. For SAP, for example, one investor might plug in relatively conservative assumptions and arrive at a fair value near €248 per share, while a more optimistic investor using different assumptions might land closer to €288, yet both can clearly see how their different stories translate into different numbers and potential decisions.
Do you think there's more to the story for SAP? Head over to our Community to see what others are saying!

This article by Simply Wall St is general in nature. We provide commentary based on historical data and analyst forecasts only using an unbiased methodology and our articles are not intended to be financial advice. It does not constitute a recommendation to buy or sell any stock, and does not take account of your objectives, or your financial situation. We aim to bring you long-term focused analysis driven by fundamental data. Note that our analysis may not factor in the latest price-sensitive company announcements or qualitative material. Simply Wall St has no position in any stocks mentioned.
Have feedback on this article? Concerned about the content? Get in touch with us directly. Alternatively, email editorial-team@simplywallst.com