
 Nasdaq
 华尔街日报
华尔街日报Does Vizsla Silver’s 178.1% 2025 Rally Still Leave Room for Further Upside?
- If you are wondering whether Vizsla Silver is still a smart buy after its huge run, or if you are arriving just as the real upside is starting, this is the right place to unpack what the current price actually implies.
- The stock has been on a tear, climbing 9.2% over the last week, 23.6% over the past month and an eye catching 178.1% year to date, with a 169.7% gain over the last year on top of strong multi year returns.
- Those moves have been underpinned by growing investor interest in silver focused explorers as metal prices and long term supply and demand narratives gain momentum, with Vizsla often mentioned in commentary around high potential silver districts in Mexico. Together, this backdrop has shifted market sentiment from speculative curiosity toward a more serious re rating story, which helps explain the sharp repricing.
- Right now, Vizsla Silver scores a 3 out of 6 valuation checks, suggesting pockets of undervaluation but also areas where the market may be fully pricing in the story. Next, we will walk through the main valuation approaches investors use, before finishing with a more holistic way to judge whether the stock is truly good value.
Approach 1: Vizsla Silver Discounted Cash Flow (DCF) Analysis
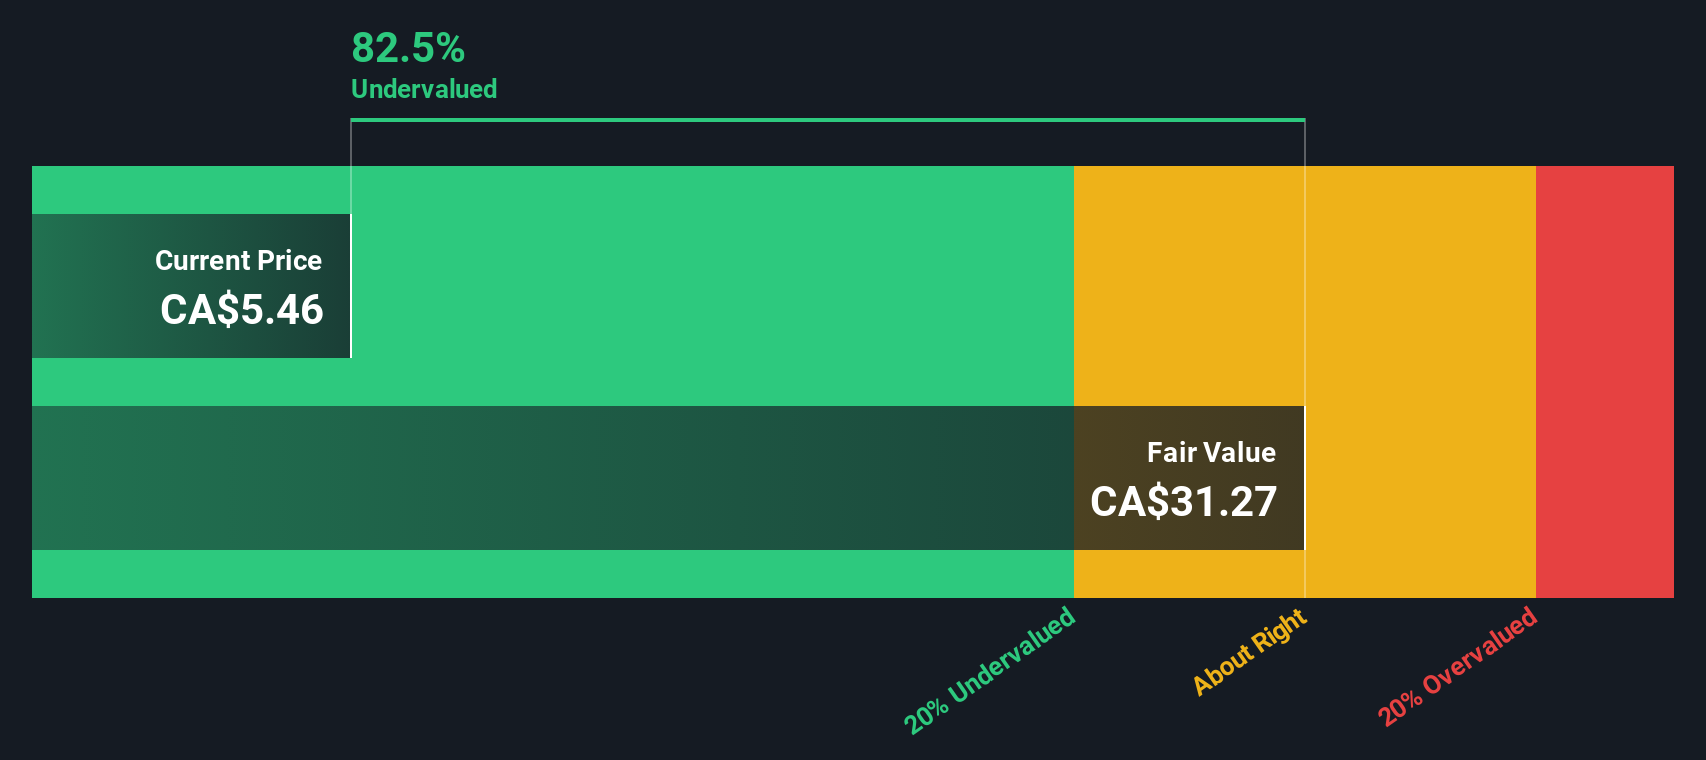
A Discounted Cash Flow, or DCF, model estimates what a business is worth by projecting its future cash flows and then discounting them back to today in CA$ terms. For Vizsla Silver, the 2 Stage Free Cash Flow to Equity model starts from current trailing twelve month free cash flow of roughly CA$36.3 Million outflow, reflecting the company is still in an investment heavy phase.
Analysts and extrapolations used by Simply Wall St expect that to flip meaningfully over time, with free cash flow projected to reach around CA$620 Million by 2030 and continue at several hundred Million per year through 2035. When all those future cash flows are discounted back, the model estimates an intrinsic value of about CA$24.98 per share.
Compared with the current share price, this implies Vizsla Silver is trading at roughly a 71.5% discount to its DCF fair value, suggesting the market is still heavily discounting the company’s long term cash generation potential.
Result: UNDERVALUED
Our Discounted Cash Flow (DCF) analysis suggests Vizsla Silver is undervalued by 71.5%. Track this in your watchlist or portfolio, or discover 933 more undervalued stocks based on cash flows.
Approach 2: Vizsla Silver Price vs Book
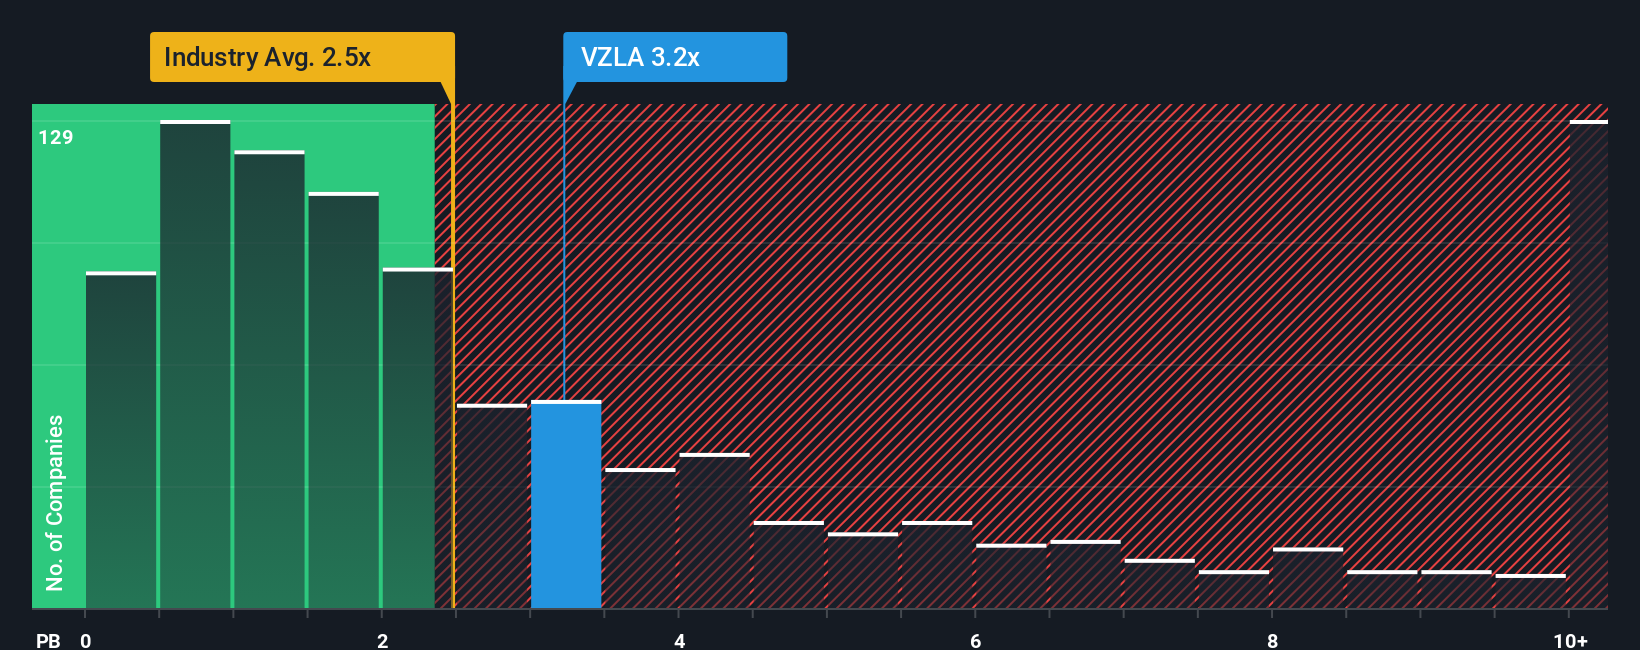
For resource companies that are not yet consistently profitable, the price to book, or P B, ratio is often a better yardstick than earnings-based multiples, because it anchors valuation to the net assets and development work already on the balance sheet rather than still-volatile profits.
In theory, higher growth potential and lower perceived risk justify a higher P B multiple, while slower growth and greater uncertainty should keep it closer to, or even below, book value. Vizsla Silver currently trades at about 4.08x book value, which is well above the Metals and Mining industry average of roughly 2.67x but actually below its direct peer group, where the average sits nearer 5.15x.
Simply Wall St’s Fair Ratio is designed to go a step further than those simple comparisons by estimating what P B multiple Vizsla should trade at given its growth outlook, project risk profile, profitability trajectory, industry, and market cap. Because this metric blends these company-specific drivers into a single target multiple, it is more informative than a basic peer or sector check. On balance, Vizsla Silver’s current 4.08x P B looks below where its Fair Ratio would sit and this suggests the shares are undervalued on this lens.
Result: UNDERVALUED
PB ratios tell one story, but what if the real opportunity lies elsewhere? Discover 1440 companies where insiders are betting big on explosive growth.
Upgrade Your Decision Making: Choose your Vizsla Silver Narrative
Earlier we mentioned that there is an even better way to understand valuation, so let us introduce you to Narratives, a simple way to connect your view of Vizsla Silver’s story to the numbers behind it, like fair value, future revenue, earnings and margins. A Narrative is your own structured storyline for a company, where you spell out what you think will happen operationally, translate that into a financial forecast and then into a fair value estimate that you can compare with today’s share price to inform your decision. Narratives on Simply Wall St, available to millions of investors through the Community page, are easy to set up, automatically crunch the numbers for you and then keep updating as new information, such as drill results, project updates, commodity price moves or earnings reports, comes in. For Vizsla Silver, one investor’s Narrative might assume a conservative development timeline and modest silver prices, while another assumes faster ramp up and higher long term prices. These different assumptions can lead to very different fair values and, therefore, different views about whether the current price looks attractive or stretched.
Do you think there's more to the story for Vizsla Silver? Head over to our Community to see what others are saying!

This article by Simply Wall St is general in nature. We provide commentary based on historical data and analyst forecasts only using an unbiased methodology and our articles are not intended to be financial advice. It does not constitute a recommendation to buy or sell any stock, and does not take account of your objectives, or your financial situation. We aim to bring you long-term focused analysis driven by fundamental data. Note that our analysis may not factor in the latest price-sensitive company announcements or qualitative material. Simply Wall St has no position in any stocks mentioned.
Have feedback on this article? Concerned about the content? Get in touch with us directly. Alternatively, email editorial-team@simplywallst.com