
 Nasdaq
 华尔街日报
华尔街日报Assessing Tradeweb Markets Valuation After Mixed Returns and Strong Electronic Trading Growth
- If you are wondering whether Tradeweb Markets is a bargain or just an expensive quality name, you are exactly the kind of investor this breakdown is for.
- The stock is down 1.5% over the last week and 0.9% over the last month, and despite a tough stretch year to date at -19.1% and -20.6% over 1 year, it is still up 67.1% over 3 years and 68.5% over 5 years.
- Those mixed returns come against a backdrop of ongoing growth in electronic fixed income and rates trading, as institutions continue shifting from voice and bilateral trading onto digital platforms like Tradeweb. At the same time, investors have been reassessing the whole electronic trading space as interest rate expectations, market volatility, and competitive dynamics change over time.
- Right now, Tradeweb scores just 0 out of 6 on our undervaluation checks, so we will unpack what that means using several valuation approaches, and then circle back at the end to a more intuitive way of thinking about what the market is really pricing in.
Tradeweb Markets scores just 0/6 on our valuation checks. See what other red flags we found in the full valuation breakdown.
Approach 1: Tradeweb Markets Excess Returns Analysis
The Excess Returns model looks at how much profit a company can generate above the return required by its shareholders, and then projects how long that value creation can continue. Instead of focusing on cash flows, it centers on the profitability of the equity already invested in the business.
For Tradeweb Markets, the model starts with a Book Value of $29.43 per share and a Stable EPS of $3.96 per share, based on weighted future Return on Equity estimates from 5 analysts. With a Cost of Equity of $2.58 per share, the company is expected to generate Excess Returns of $1.39 per share, supported by an Average Return on Equity of 12.44%. The Stable Book Value is projected to grow to $31.87 per share, using estimates from 3 analysts.
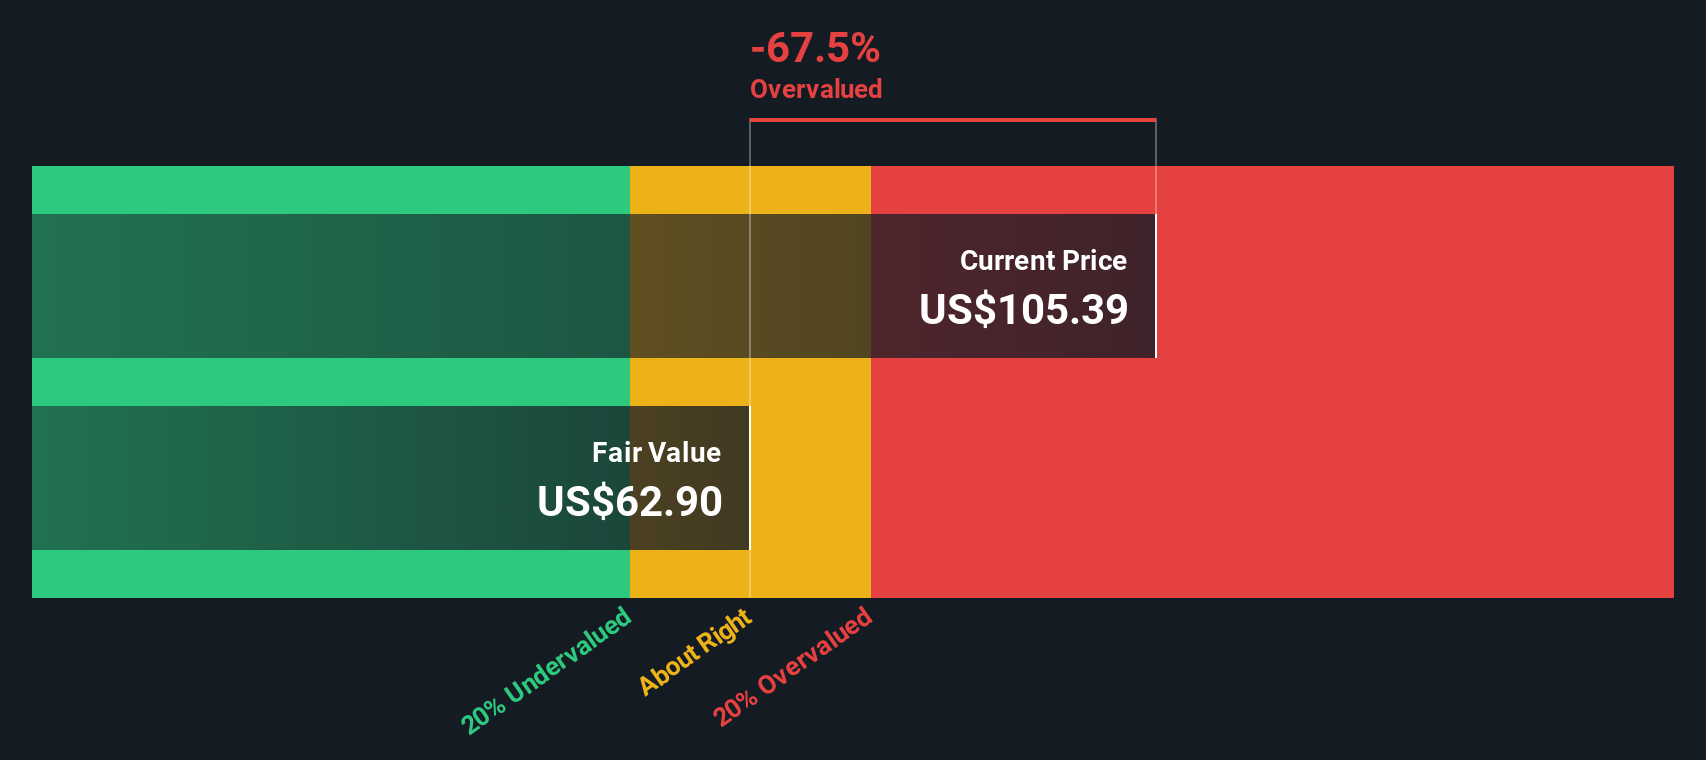
When these excess returns are capitalized, the Excess Returns valuation implies Tradeweb is trading at roughly a 75.5% premium to its estimated intrinsic value. This suggests the shares are meaningfully overvalued on this framework.
Result: OVERVALUED
Our Excess Returns analysis suggests Tradeweb Markets may be overvalued by 75.5%. Discover 935 undervalued stocks or create your own screener to find better value opportunities.
Approach 2: Tradeweb Markets Price vs Earnings
For profitable businesses like Tradeweb Markets, the price to earnings ratio is a useful shorthand for how much investors are willing to pay today for each dollar of current earnings. It bundles together the market's expectations for growth, perceived risk, and the quality or consistency of those earnings into a single, comparable metric.
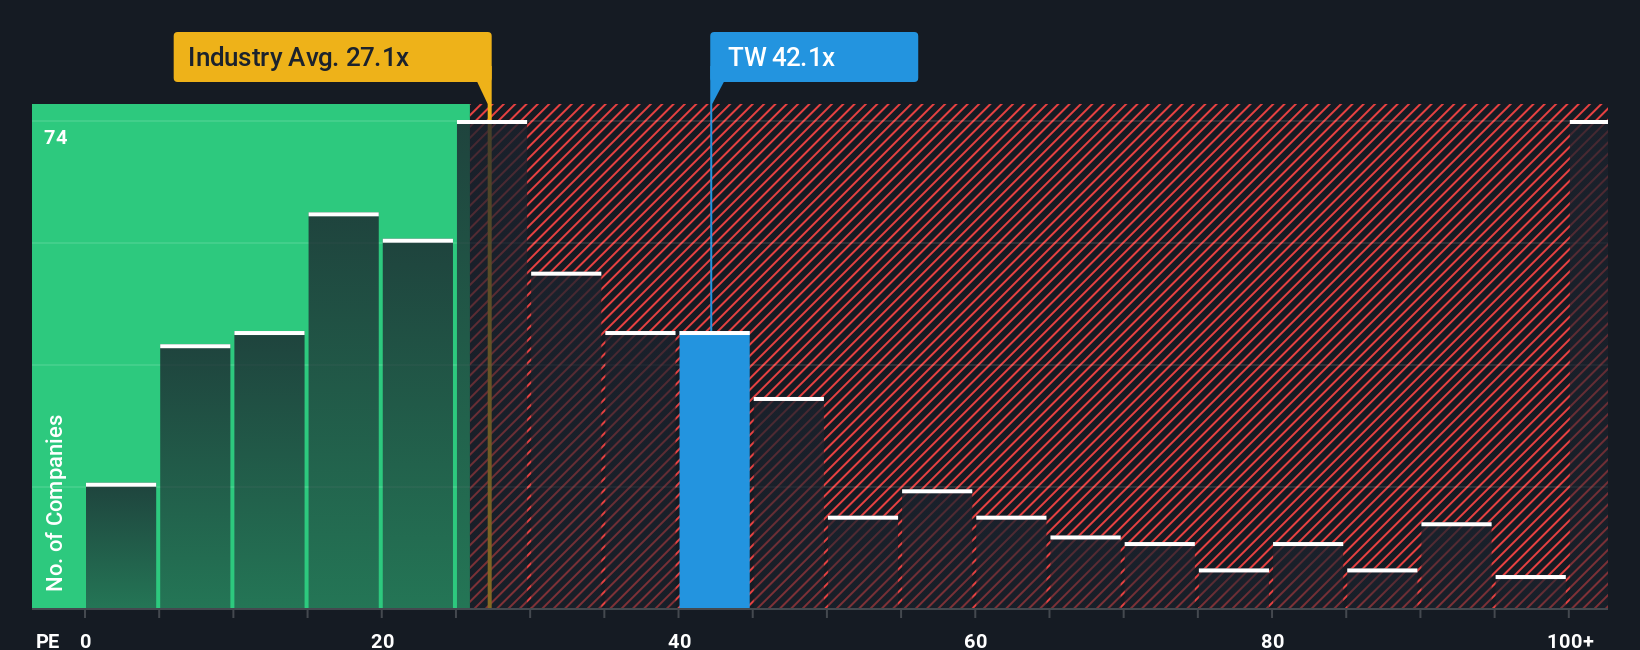
In general, faster growing and more resilient companies tend to be associated with a higher, or more expensive, PE ratio, while slower growing or riskier names tend to trade on a lower multiple. Tradeweb currently trades on a PE of 36.0x. This sits well above the Capital Markets industry average of about 23.6x and also above its peer group average of roughly 27.3x. This indicates that the market is already assigning it a premium valuation.
Simply Wall St's Fair Ratio framework goes a step further than simple comparisons. It estimates what PE multiple a company might reasonably trade on after accounting for its earnings growth outlook, profitability, risk profile, industry positioning and market capitalization. For Tradeweb, this Fair Ratio comes out at 16.6x, which is far below the current 36.0x. That sizable gap suggests the shares are pricing in far more optimism than the fundamentals justify, so on this metric the stock appears stretched rather than cheap.
Result: OVERVALUED
PE ratios tell one story, but what if the real opportunity lies elsewhere? Discover 1441 companies where insiders are betting big on explosive growth.
Upgrade Your Decision Making: Choose your Tradeweb Markets Narrative
Earlier we mentioned that there is an even better way to understand valuation, so let's introduce you to Narratives, a simple way to connect your view of Tradeweb Markets' story with a set of future revenue, earnings and margin assumptions that roll up into a fair value estimate, all within the Community page on Simply Wall St where millions of investors share their perspectives.
Instead of looking at the PE ratio in isolation, a Narrative helps you spell out why you think Tradeweb's business will evolve the way it will. It then translates that story into a financial forecast, and lets you compare the resulting Fair Value with today's share price so you can decide whether it looks buyable, holdable, or worth trimming.
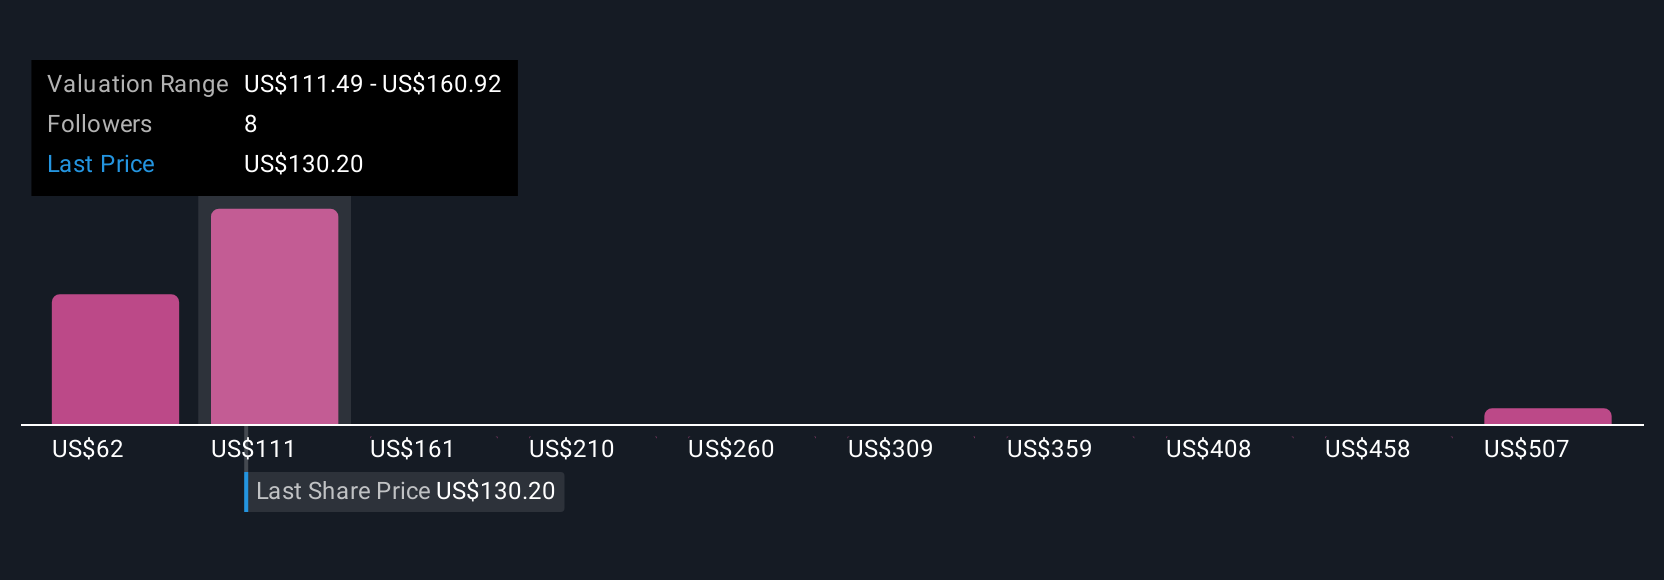
Because Narratives on the platform update dynamically as new information arrives, such as Tradeweb's latest on chain data initiatives or record trading volumes, you can quickly see how other investors are revising their expectations. These range from the more cautious views closer to a fair value of about $118 per share through to more optimistic perspectives nearer $210, and you can use that range to sanity check and refine your own investment decision.
Do you think there's more to the story for Tradeweb Markets? Head over to our Community to see what others are saying!
This article by Simply Wall St is general in nature. We provide commentary based on historical data and analyst forecasts only using an unbiased methodology and our articles are not intended to be financial advice. It does not constitute a recommendation to buy or sell any stock, and does not take account of your objectives, or your financial situation. We aim to bring you long-term focused analysis driven by fundamental data. Note that our analysis may not factor in the latest price-sensitive company announcements or qualitative material. Simply Wall St has no position in any stocks mentioned.
Have feedback on this article? Concerned about the content? Get in touch with us directly. Alternatively, email editorial-team@simplywallst.com