
 华尔街日报
华尔街日报AUTO1 Group SE's (ETR:AG1) high institutional ownership speaks for itself as stock continues to impress, up 22% over last week
Key Insights
- Institutions' substantial holdings in AUTO1 Group implies that they have significant influence over the company's share price
- 51% of the business is held by the top 9 shareholders
- Ownership research along with analyst forecasts data help provide a good understanding of opportunities in a stock
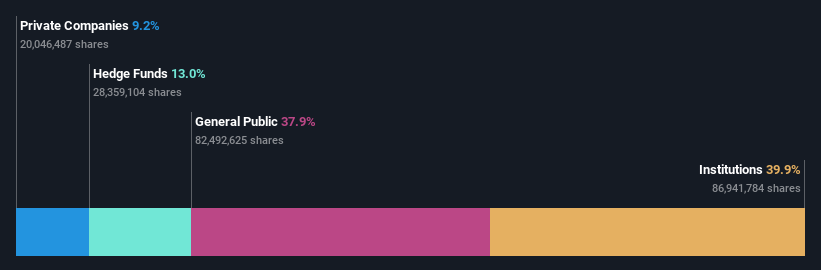
To get a sense of who is truly in control of AUTO1 Group SE (ETR:AG1), it is important to understand the ownership structure of the business. We can see that institutions own the lion's share in the company with 40% ownership. In other words, the group stands to gain the most (or lose the most) from their investment into the company.
And as as result, institutional investors reaped the most rewards after the company's stock price gained 22% last week. One-year return to shareholders is currently 520% and last week’s gain was the icing on the cake.
In the chart below, we zoom in on the different ownership groups of AUTO1 Group.
Check out our latest analysis for AUTO1 Group
What Does The Institutional Ownership Tell Us About AUTO1 Group?
Many institutions measure their performance against an index that approximates the local market. So they usually pay more attention to companies that are included in major indices.
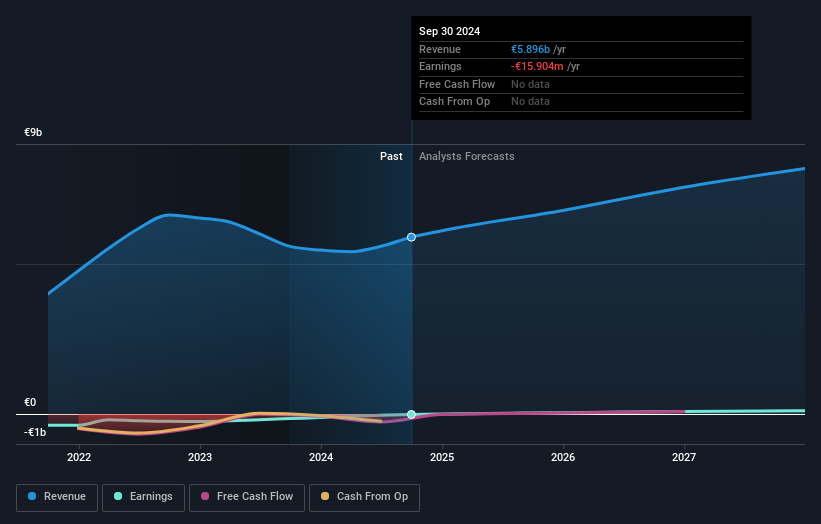
We can see that AUTO1 Group does have institutional investors; and they hold a good portion of the company's stock. This implies the analysts working for those institutions have looked at the stock and they like it. But just like anyone else, they could be wrong. When multiple institutions own a stock, there's always a risk that they are in a 'crowded trade'. When such a trade goes wrong, multiple parties may compete to sell stock fast. This risk is higher in a company without a history of growth. You can see AUTO1 Group's historic earnings and revenue below, but keep in mind there's always more to the story.
It would appear that 13% of AUTO1 Group shares are controlled by hedge funds. That's interesting, because hedge funds can be quite active and activist. Many look for medium term catalysts that will drive the share price higher. Our data shows that Cadian Capital Management, LP is the largest shareholder with 13% of shares outstanding. With 9.2% and 8.4% of the shares outstanding respectively, Hkvv GmbH and Morgan Stanley, Investment Banking and Brokerage Investments are the second and third largest shareholders.
We also observed that the top 9 shareholders account for more than half of the share register, with a few smaller shareholders to balance the interests of the larger ones to a certain extent.
While studying institutional ownership for a company can add value to your research, it is also a good practice to research analyst recommendations to get a deeper understand of a stock's expected performance. There are plenty of analysts covering the stock, so it might be worth seeing what they are forecasting, too.
Insider Ownership Of AUTO1 Group
The definition of company insiders can be subjective and does vary between jurisdictions. Our data reflects individual insiders, capturing board members at the very least. Company management run the business, but the CEO will answer to the board, even if he or she is a member of it.
Insider ownership is positive when it signals leadership are thinking like the true owners of the company. However, high insider ownership can also give immense power to a small group within the company. This can be negative in some circumstances.
We note our data does not show any board members holding shares, personally. Given we are not picking up on insider ownership, we may have missing data. Therefore, it would be interesting to assess the CEO compensation and tenure, here.
General Public Ownership
The general public, who are usually individual investors, hold a 38% stake in AUTO1 Group. While this size of ownership may not be enough to sway a policy decision in their favour, they can still make a collective impact on company policies.
Private Company Ownership
Our data indicates that Private Companies hold 9.2%, of the company's shares. It's hard to draw any conclusions from this fact alone, so its worth looking into who owns those private companies. Sometimes insiders or other related parties have an interest in shares in a public company through a separate private company.
Next Steps:
I find it very interesting to look at who exactly owns a company. But to truly gain insight, we need to consider other information, too. Consider for instance, the ever-present spectre of investment risk. We've identified 1 warning sign with AUTO1 Group , and understanding them should be part of your investment process.
Ultimately the future is most important. You can access this free report on analyst forecasts for the company.
NB: Figures in this article are calculated using data from the last twelve months, which refer to the 12-month period ending on the last date of the month the financial statement is dated. This may not be consistent with full year annual report figures.
Have feedback on this article? Concerned about the content? Get in touch with us directly. Alternatively, email editorial-team (at) simplywallst.com.
This article by Simply Wall St is general in nature. We provide commentary based on historical data and analyst forecasts only using an unbiased methodology and our articles are not intended to be financial advice. It does not constitute a recommendation to buy or sell any stock, and does not take account of your objectives, or your financial situation. We aim to bring you long-term focused analysis driven by fundamental data. Note that our analysis may not factor in the latest price-sensitive company announcements or qualitative material. Simply Wall St has no position in any stocks mentioned.